Turnkey two story restaurant with a unique 3rd floor bar and rooftop deck. The building features an elevator and restrooms on every level.
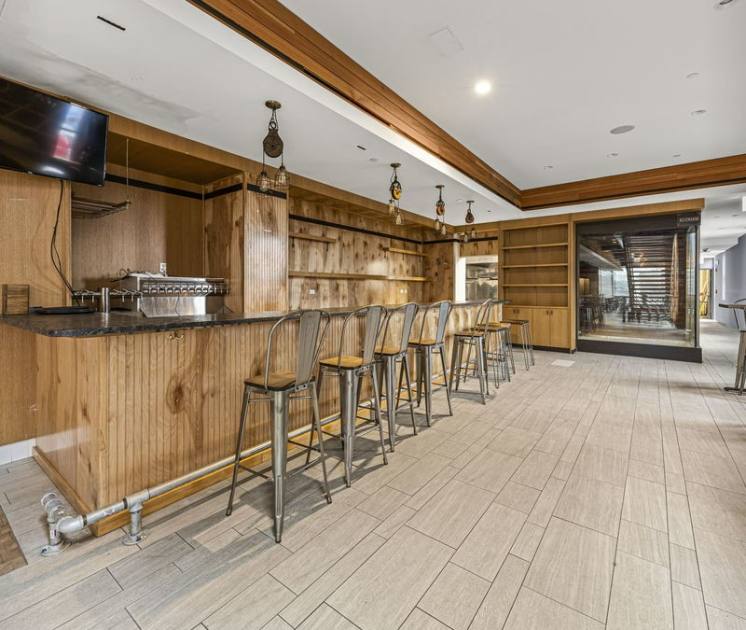
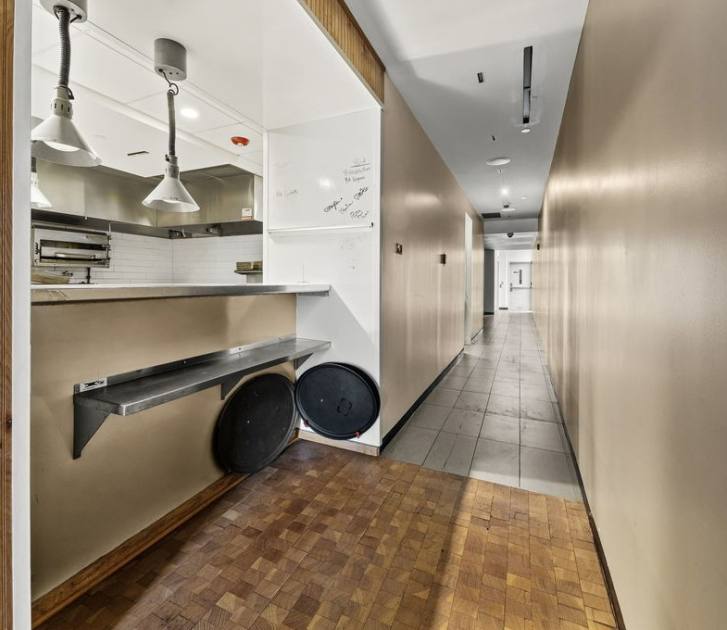
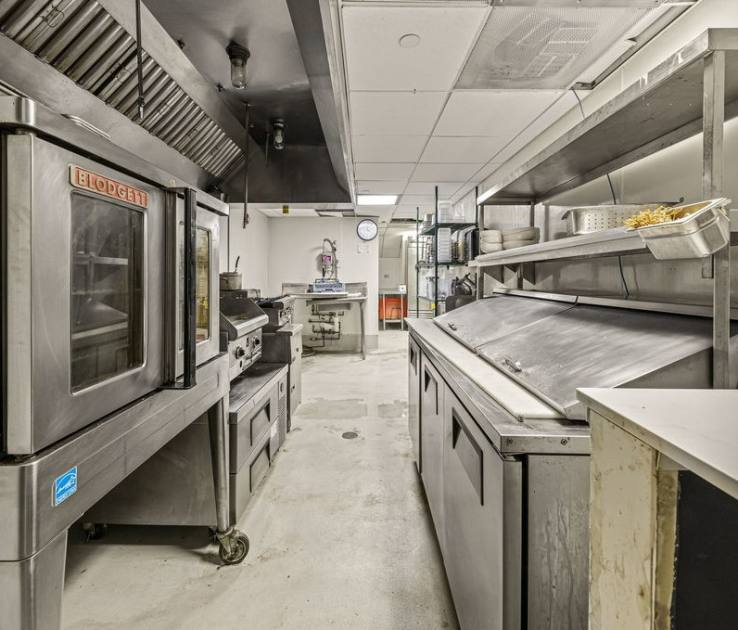
The 3,268 SF ground floor is a fully built-out restaurant space featuring exposed brick, a bar with countertop seating, fully equipped kitchen with two hoods and prep area and outdoor seating on Jefferson St.
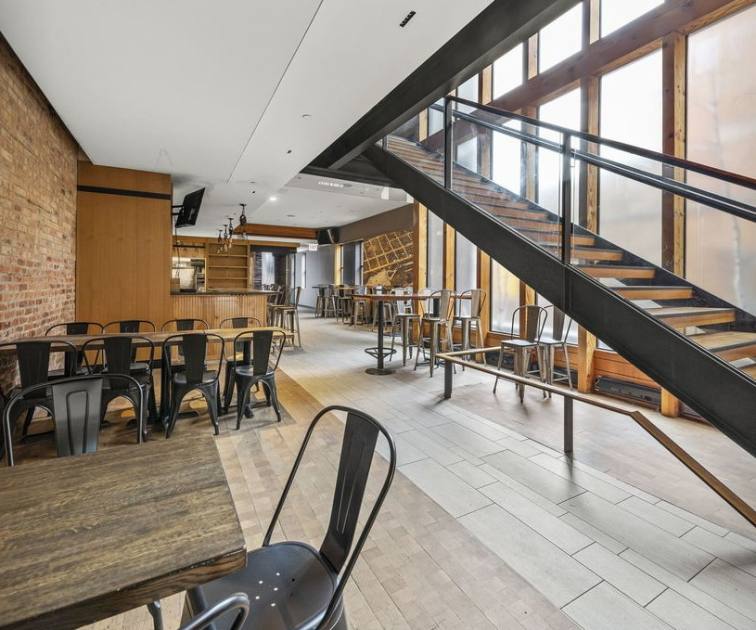
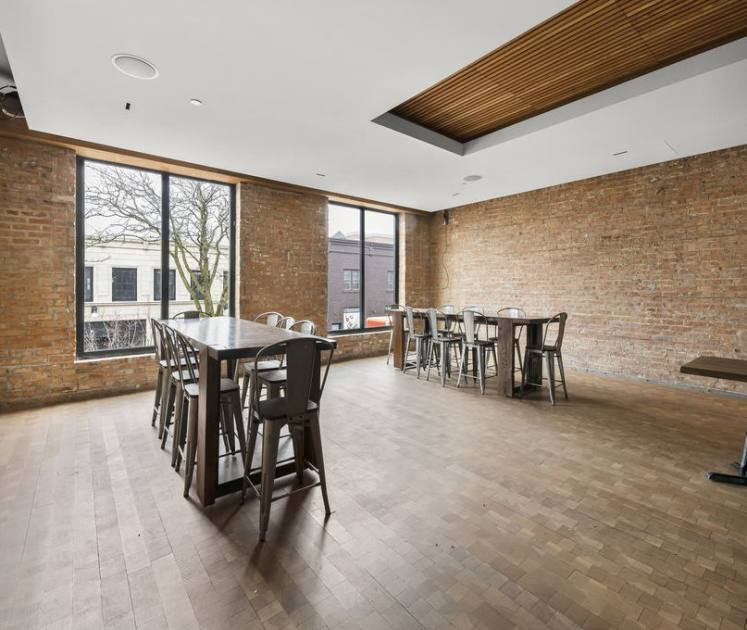
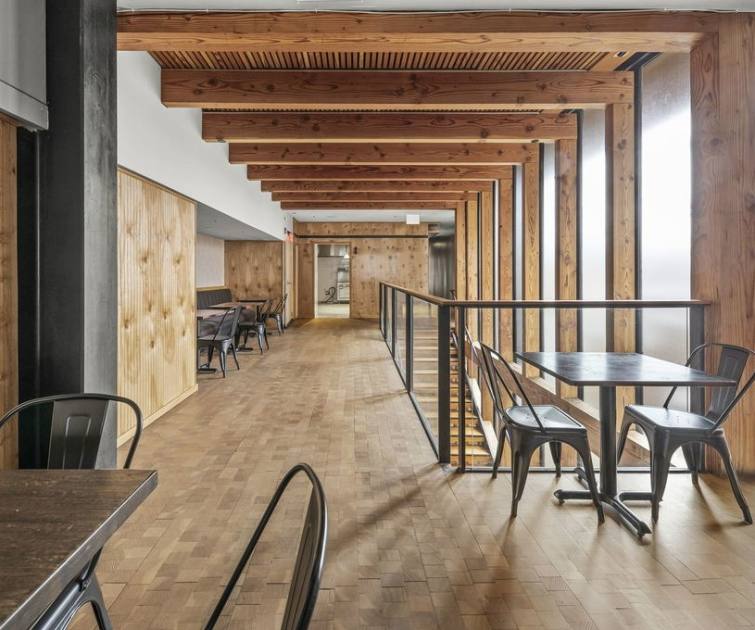
The 3,335 SF 2nd floor features a modern design dining room with wood floors, exposed brick and beautiful wood feature ceilings. There is also a second fully equipped kitchen.
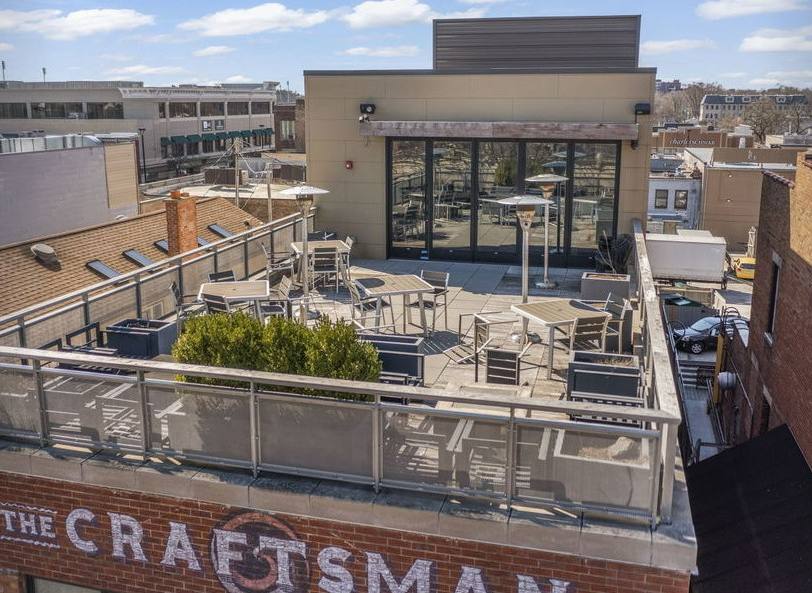
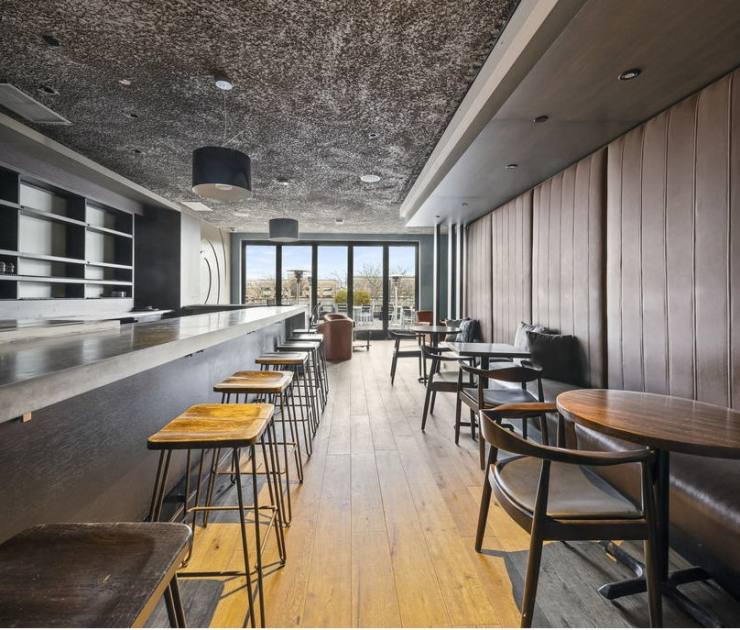
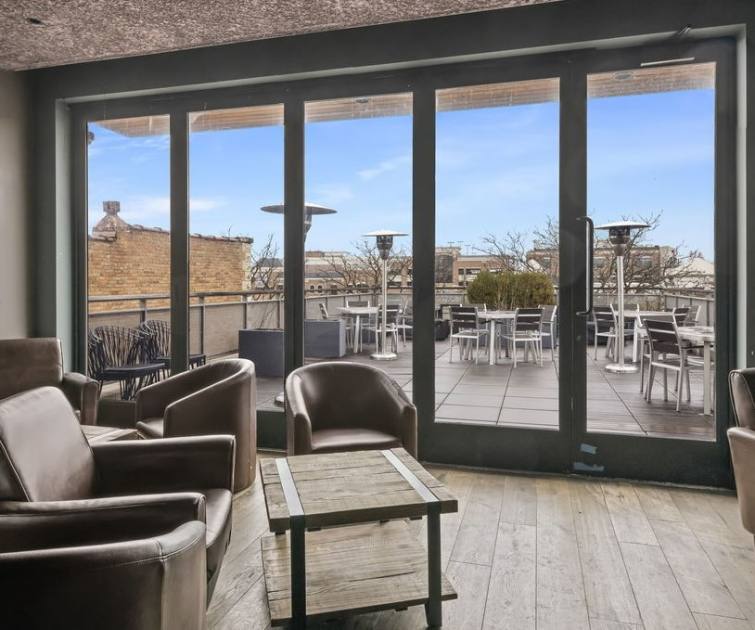
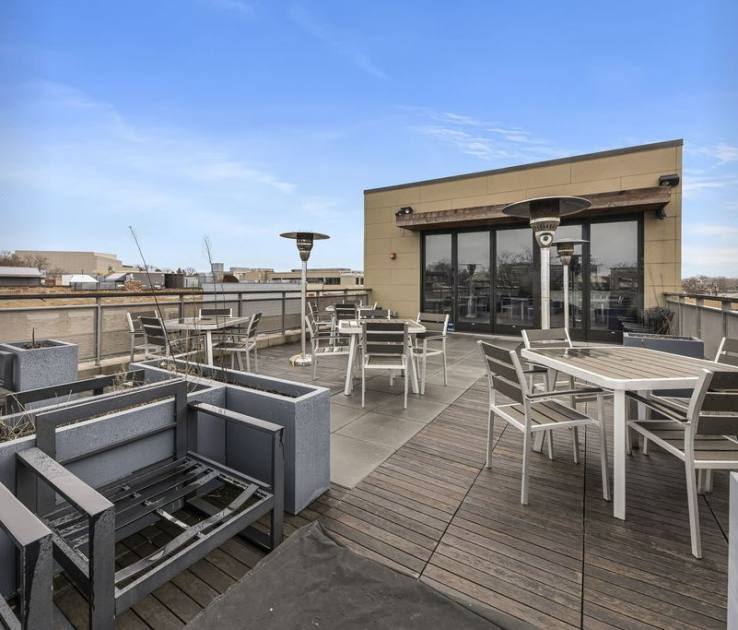
The 2,608 SF 3rd floor offers a rooftop bar and outdoor deck with seating. The space also has a separate entrance from Jefferson St.
On the main thoroughfare in downtown Naperville, a dining and shopping destination. Naperville has ranked number one for retail and restaurant sales in Illinois outside of Chicago for two consecutive years.
Surrounded by national restaurants and retailers including Starbucks Reserve, The Apple Store, Sullivan's Steakhouse, Hugo's Frog Bar, Lululemon and many more. A few blocks from the famed Riverwalk and a short distance to the Metra Train Station and I-88. The location features excellent walkability with a walk score of 94 out 100. There are multiple free public parking lots and garages within a few blocks.
No part of this information may be copied, reproduced, repurposed, or screen-captured for any commercial purpose without prior written authorization from MyEListing.
While we strive to provide the most accurate information, all listing information, and demographic data, is provided by third-parties. As such, MyEListing will not be responsible for the accuracy of the information. It is strongly recommended that you verify all information with the listing agent, and any relevant agencies, prior to making any decisions.
What is the building size of this commercial Retail property?
The size of this multi-unit property varies between 3402 - 9211 square feet
What kind of Retail is the propery at 16 West Jefferson Avenue?
The property at 16 West Jefferson Avenue Naperville, IL 60540 is listed as a Food Service Retail property
What is the population within 1 mile of 16 West Jefferson Avenue in Naperville?
The population within 1 mile of 16 West Jefferson Avenue Naperville, IL 60540 is 13,722 people.
Who do I contact for questions about 16 West Jefferson Avenue?