Commercial Land
Mall Loop Dr. Joliet, IL 60431
Mall Loop Dr. Joliet, IL 60431
Details & Description
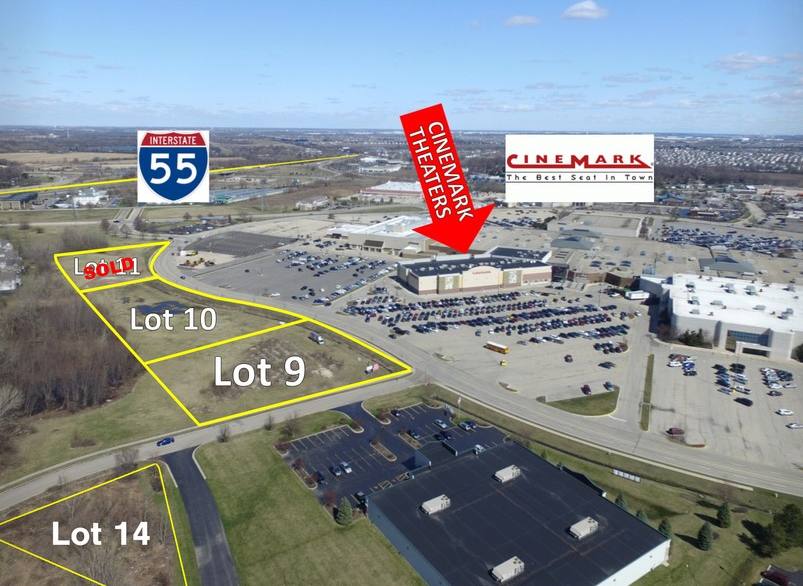
Property Highlights
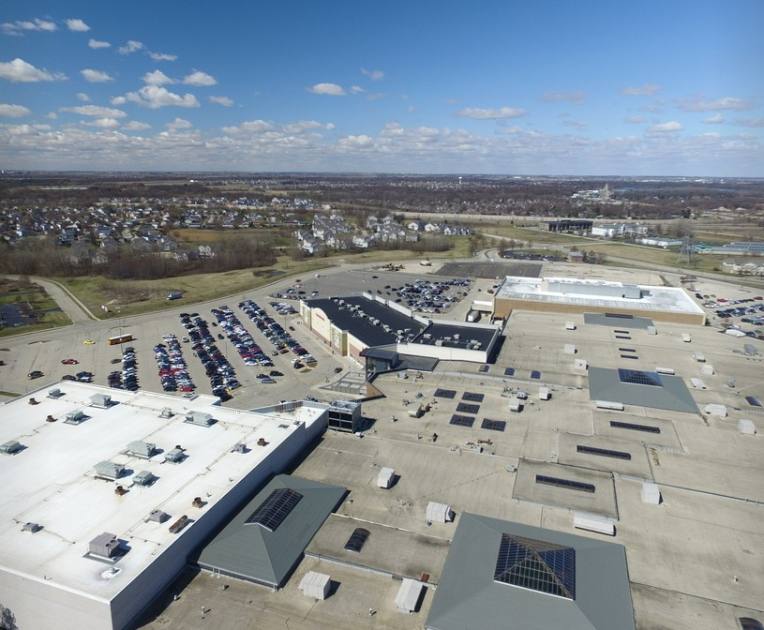
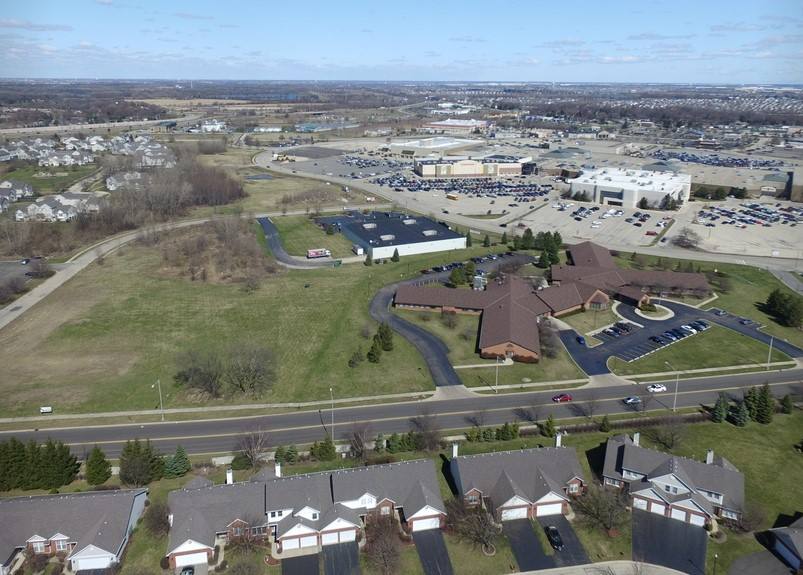
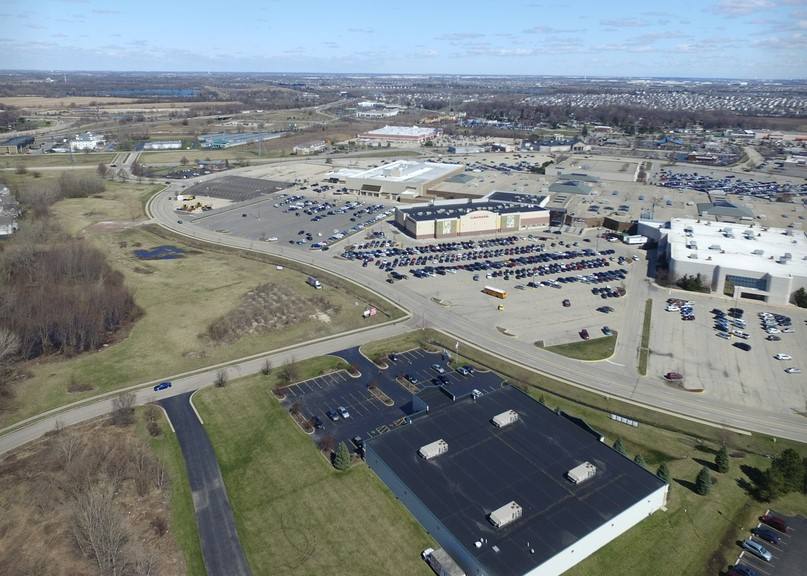
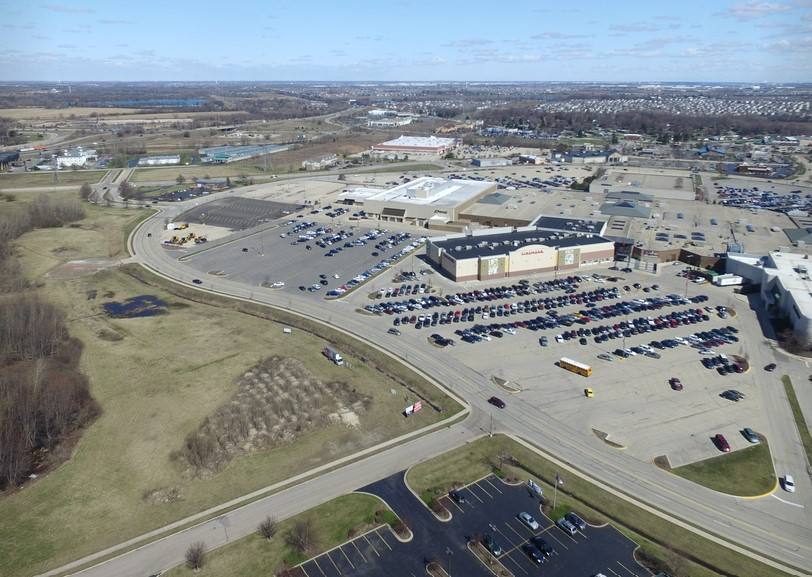
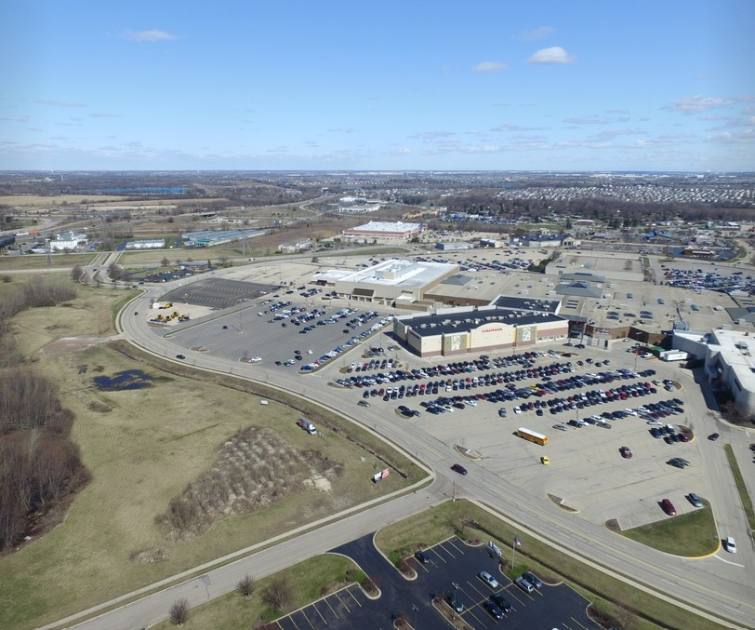
- • Next to popular Westfield Louis-Joliet Mall
- • Adjacent to newly opened Hilton Home2
- • Across from Cinemark Theater
- • Conveniently located off I-55 and Route 30
- • $7.00 - $9.00 / SF
Additional Photos

Listing Agents

Steve Caton
O: 815-436-5700
M: 815-954-5300
steve@catoncommercial.com
O: 815-436-5700
M: 815-954-5300
steve@catoncommercial.com

Ron Swacker
O: 815-436-5700
M: 815-260-9177
ron@catoncommercial.com
O: 815-436-5700
M: 815-260-9177
ron@catoncommercial.com
While we strive to provide the most accurate information, all listing information, and demographic data, is provided by third-parties. As such, MyEListing will not be responsible for the accuracy of the information. It is strongly recommended that you verify all information with the listing agent, and any relevant agencies, prior to making any decisions.