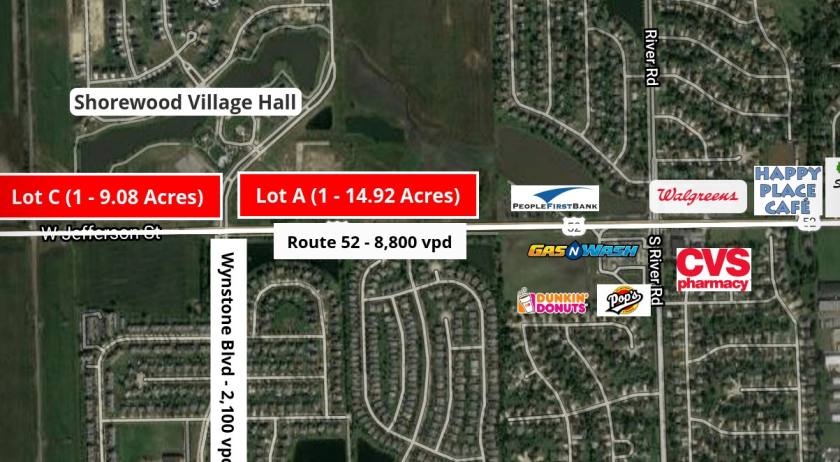
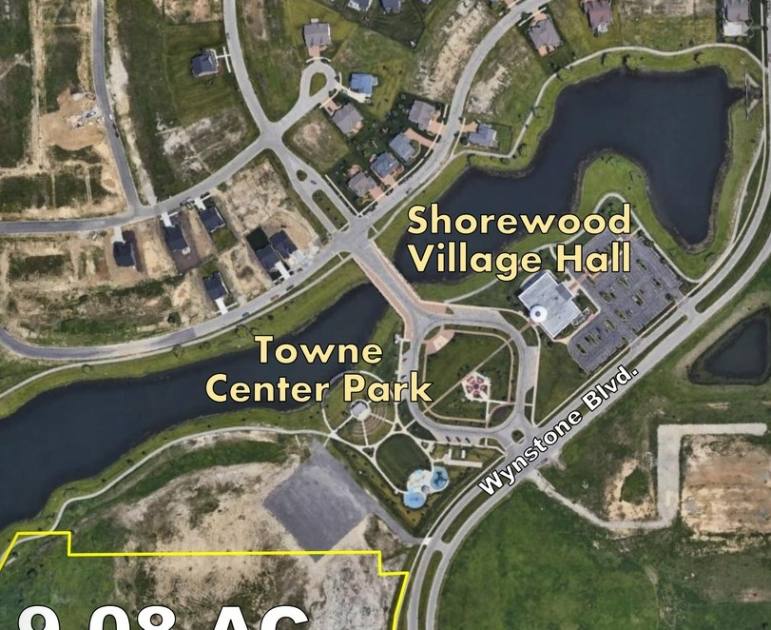
1-Mile | 3-Miles | 5-Miles | ||
---|---|---|---|---|
Total Population | 3,652 | 47,053 | 104,821 | |
Population Median Age | 49 | 36 | 37 | |
Population by Age | 0-9 Yrs | 256 (7%) | 6193 (13%) | 12947 (12%) |
10-19 Yrs | 312 (8%) | 7914 (16%) | 16837 (16%) | |
20-29 Yrs | 373 (10%) | 5648 (12%) | 13881 (13%) | |
30-39 Yrs | 286 (7%) | 5804 (12%) | 13047 (12%) | |
40-49 Yrs | 299 (8%) | 7469 (15%) | 16098 (15%) | |
50-59 Yrs | 523 (14%) | 5959 (12%) | 13662 (13%) | |
60-69 Yrs | 953 (26%) | 4783 (10%) | 10791 (10%) | |
70+ Yrs | 651 (17%) | 3281 (6%) | 7559 (7%) | |
Median HH Income | $102,830 | $106,731 | $95,703 | |
Total Household Income | < 24K | 76 (5%) | 1035 (6%) | 3136 (9%) |
25-49K | 211 (14%) | 1354 (9%) | 4328 (12%) | |
50-74K | 243 (16%) | 2420 (16%) | 5583 (16%) | |
75-99K | 202 (13%) | 2071 (13%) | 5105 (14%) | |
100-199K | 578 (38%) | 6634 (44%) | 13588 (39%) | |
200K+ | 190 (12%) | 1467 (9%) | 2810 (8%) | |
Highest Education Level | No Diploma | 119 | 2073 | 4744 |
Diploma or GED | 571 | 7586 | 18425 | |
Some College | 659 | 7524 | 17550 | |
Assoc. Degree | 247 | 2632 | 5925 | |
Bachelors Degree | 772 | 6583 | 13882 | |
Higher Degree | 549 | 3871 | 7414 | |
Total Housing Units | 1,521 | 15,463 | 35,896 | |
--Owner-Occupied | 1,413 | 13,520 | 29,752 | |
--Renter-Occupied | 86 | 1,461 | 4,798 | |
Owner-Occupied Values | < 100K | 41 | 362 | 1118 |
100-199K | 202 | 3134 | 9187 | |
200-299K | 505 | 6718 | 13783 | |
300-399K | 533 | 2521 | 4119 | |
400-499K | 74 | 381 | 706 | |
500K+ | 59 | 405 | 838 | |
Total Working Age Population | 3,215 | 35,670 | 80,749 | |
In Work Force | 1,688 | 25,303 | 57,430 | |
Not In Work Force | 1,526 | 10,367 | 23,319 | |
Workforce Employed | 1,625 | 23,882 | 54,532 | |
Workforce Unemployed | 64 | 1,402 | 2,869 | |
Civlian Workforce | 1,688 | 25,284 | 57,401 | |
Military Workforce | 0 | 19 | 28 | |
Total Households | 1,500 | 14,981 | 34,549 | |
Family Households | 1,167 | 11,968 | 26,631 | |
Non-Family Households | 332 | 3,013 | 7,918 | |
Married Couple | 1,069 | 10,051 | 21,585 | |
Other Family | 99 | 1,917 | 5,046 | |
Married w/Child | 220 | 5,032 | 10,244 | |
Single Male w/Child | 22 | 316 | 785 | |
Single Female w/Child | 10 | 702 | 1,873 |
Population Change Last Two Decades - Plus Projection
2000 | % | 2010 | % | 2020 | % | 2030 | |
---|---|---|---|---|---|---|---|
Illinois | 12,419,293 | +3 | 12,830,632 | +12 | 14,316,487 | +6 | 15,138,849 |
Kendall County | 54,544 | +110 | 114,736 | -31 | 78,694 | +8 | 85,060 |
Grundy County | 37,535 | +33 | 50,063 | -7 | 46,454 | +9 | 50,414 |
Will County | 502,266 | +35 | 677,560 | +34 | 907,625 | +20 | 1,093,207 |
Total Working Age Population:
Total Households:
Total Working Age Population:
Total Households:
Total Working Age Population:
Total Households: