Commercial Land
2565 Plainfield Road Joliet, IL 60435
2565 Plainfield Road Joliet, IL 60435
Details & Description
Property Highlights
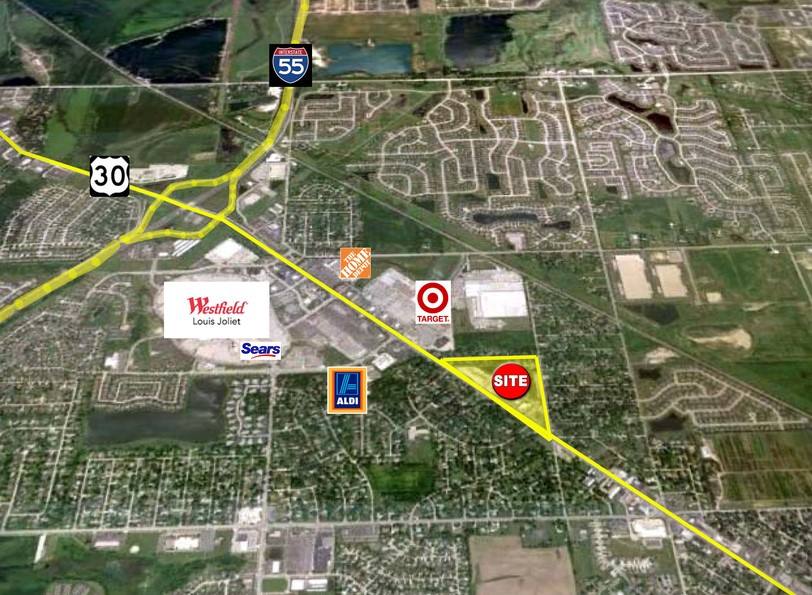
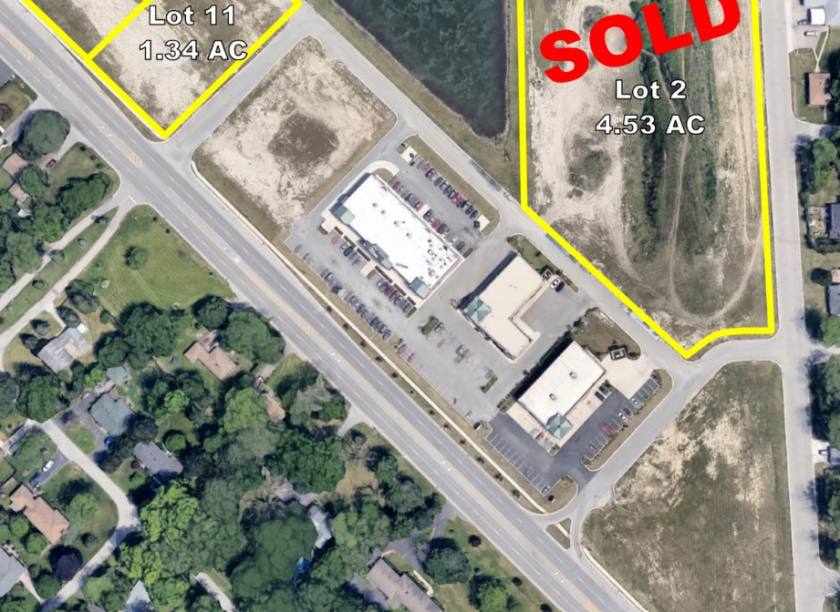
• Great site for restaurant, medical/office or retail
• Frontage on Route 30 (Plainfield Rd)
Listing Agents

Bill Caton
O: 815-370-1236
M: 331-333-1155
bill@catoncommercial.com
O: 815-370-1236
M: 331-333-1155
bill@catoncommercial.com
While we strive to provide the most accurate information, all listing information, and demographic data, is provided by third-parties. As such, MyEListing will not be responsible for the accuracy of the information. It is strongly recommended that you verify all information with the listing agent, and any relevant agencies, prior to making any decisions.