Lot Size at ±0.29 Acres
Block 1859, Lot 32
Corner Traffic Light Location Along Busy Central Avenue
Across from Bus Stop (NJ Transit 5 Servicing East Orange – Newark Penn Station)
Nearby Services Include Restaurants, Salons, UPS, Walgreens, NJ Motor Vehicle Commission
Zoned R1 (Allows for Residential Development Above Commercial Space)
Taxes at $3,734 (2022)
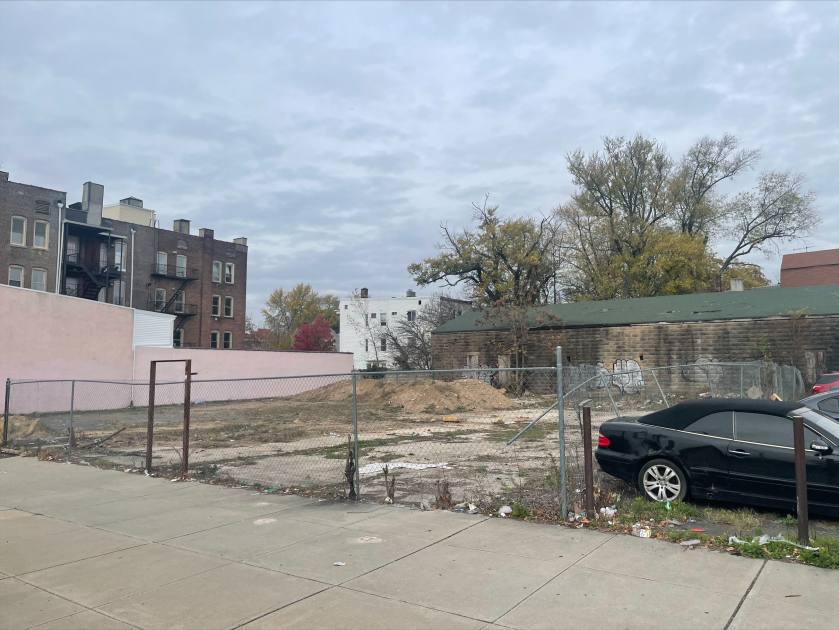
***Vacant Land, No Building Structure Currently Exist Onsite***
Approx. 0.8 Miles to I-280
Approx. 1.4 Miles to Garden State Parkway Exit 144
Approx. 4.1 Miles to I-78
Approx. 5.7 Miles to Newark Liberty International Airport
No part of this information may be copied, reproduced, repurposed, or screen-captured for any commercial purpose without prior written authorization from MyEListing.
While we strive to provide the most accurate information, all listing information, and demographic data, is provided by third-parties. As such, MyEListing will not be responsible for the accuracy of the information. It is strongly recommended that you verify all information with the listing agent, and any relevant agencies, prior to making any decisions.
What is the asking price for 573 Central Avenue in Newark?
The asking price for 573 Central Avenue is $799,999
How much land does the Newark, NJ property at 573 Central Avenue include?
573 Central Avenue in Newark includes 0.290 acres of land
What kind of Land is the propery at 573 Central Avenue?
The property at 573 Central Avenue Newark, NJ 07107 is listed as a Mixed Use Land Land property
What is the population within 1 mile of 573 Central Avenue in Newark?
The population within 1 mile of 573 Central Avenue Newark, NJ 07107 is 53,748 people.
Who do I contact for questions about 573 Central Avenue?
You should contact the listing agent,
Juan Disla, for any details regarding this commercial listing.