Yoga room
State-of-the-art fitness center
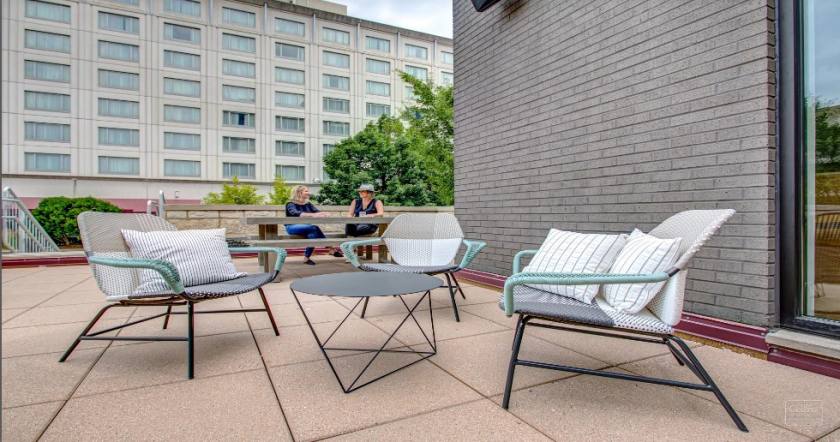
Zen garden
Modern lounge break area
Onsite food service
Conferencing center
Executive underground parking
CTA and Metra shuttle service
The Power of Choice: More options, competitive pricing, and streamlined move-in process.
AT&T Fiber provides business-grade internet with guaranteed upload & View speeds Comcast Business will soon be available for dedicated, business-grade internet with speeds up to 10Gbps Windstream is available on-demand for businesses looking to secure fixed-wireless service as a primary or back-up provider Trusted Connection: Reliable infrastructure for 24/7 connectivity.
Multiple Points of Entry & diverse riser pathways allow for maximum redundancy to mitigate the risk of an internet outages Back-up generators are in place to keep critical services online at all times.
Equipment is protected with proper infrastructure and protocols to keep your business online Flexible & Future-Ready: Investing in tenants’ futures & ability to evolve.
Adaptable space that can accommodate future technology advancements.
Ample capacity to add new service providers.
Active partnership with WiredScore and their team of engineers to drive our commitment to innovative, best-in-class technology experience.
No part of this information may be copied, reproduced, repurposed, or screen-captured for any commercial purpose without prior written authorization from MyEListing.
While we strive to provide the most accurate information, all listing information, and demographic data, is provided by third-parties. As such, MyEListing will not be responsible for the accuracy of the information. It is strongly recommended that you verify all information with the listing agent, and any relevant agencies, prior to making any decisions.
What is the building size of this commercial Office property?
The size of this multi-unit property varies between 3832 - 17887 square feet
What kind of Office is the propery at 6300 North River Road?
The property at 6300 North River Road Rosemont, IL 60018 is listed as a Professional Office property
What is the population within 1 mile of 6300 North River Road in Rosemont?
The population within 1 mile of 6300 North River Road Rosemont, IL 60018 is 8,218 people.
Who do I contact for questions about 6300 North River Road?
You should contact the listing agent,
Jason Simon, for any details regarding this commercial listing.