Office Space
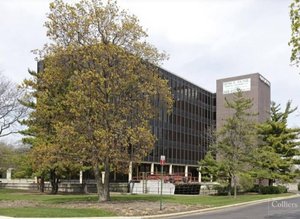
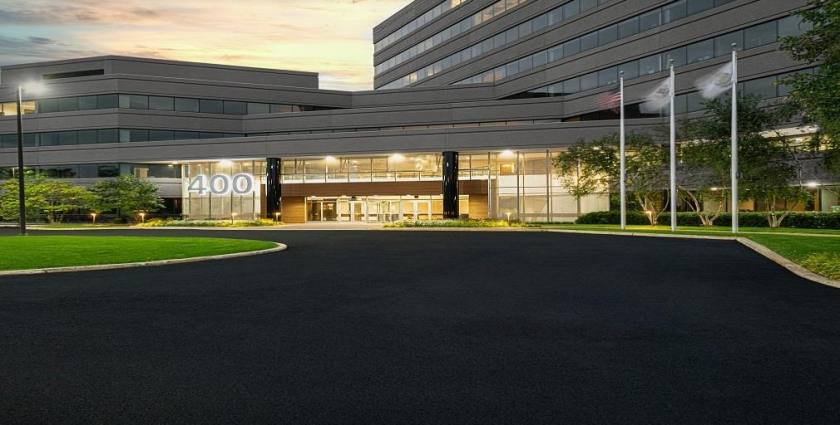
400 Skokie Boulevard Northbrook, IL 60062
400 Skokie Boulevard Northbrook, IL 60062

Details & Description
Property Highlights
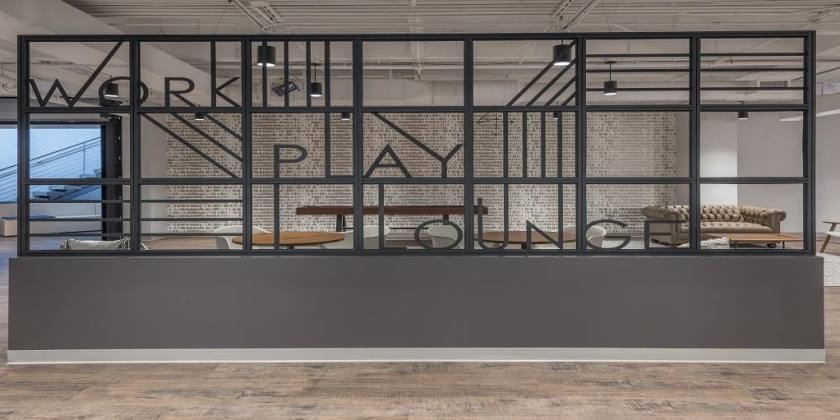
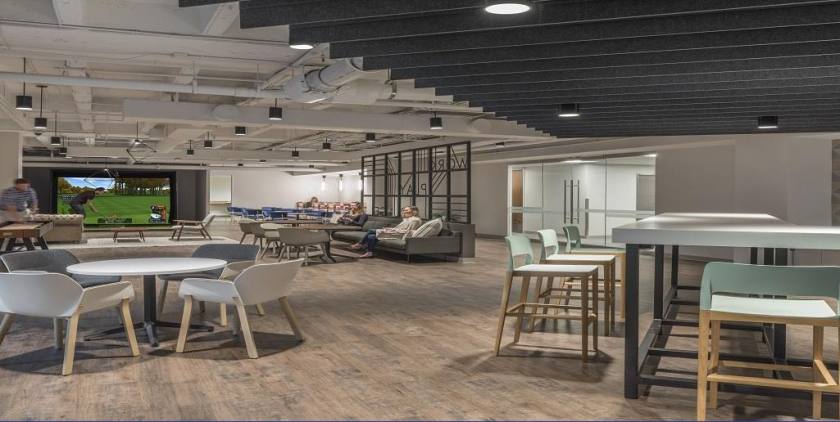
• 5 Conference Rooms and Large Auditorium. Small, mid or large sized business, we’ve got a space for you
• Small and Large Office Spaces. No matter what the size of your business, we have the space for you
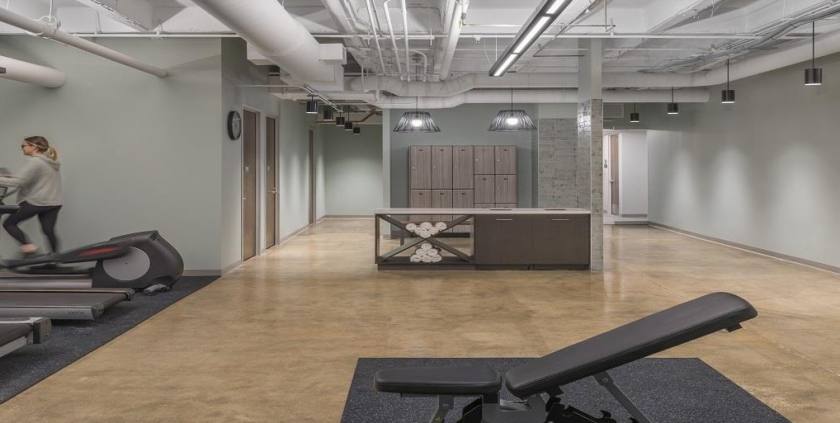
Additional Photos


Listing Agents

Darryl Silverman
O: 847-698-8271
M: 847-609-2164
darryl.silverman@colliers.com
O: 847-698-8271
M: 847-609-2164
darryl.silverman@colliers.com

Jonathon Connor
O: 847-698-8246
M: 847-436-6664
jonathon.connor@colliers.com
O: 847-698-8246
M: 847-436-6664
jonathon.connor@colliers.com
While we strive to provide the most accurate information, all listing information, and demographic data, is provided by third-parties. As such, MyEListing will not be responsible for the accuracy of the information. It is strongly recommended that you verify all information with the listing agent, and any relevant agencies, prior to making any decisions.