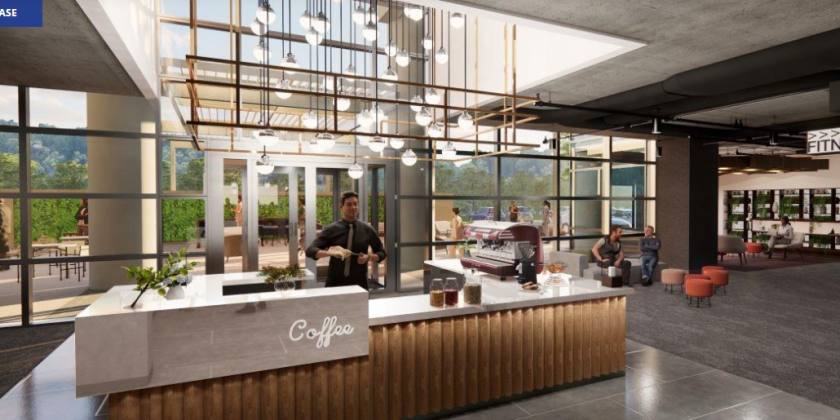
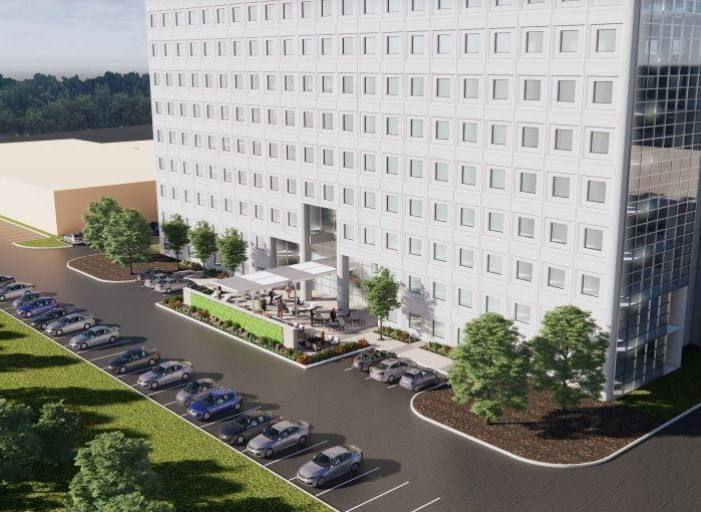
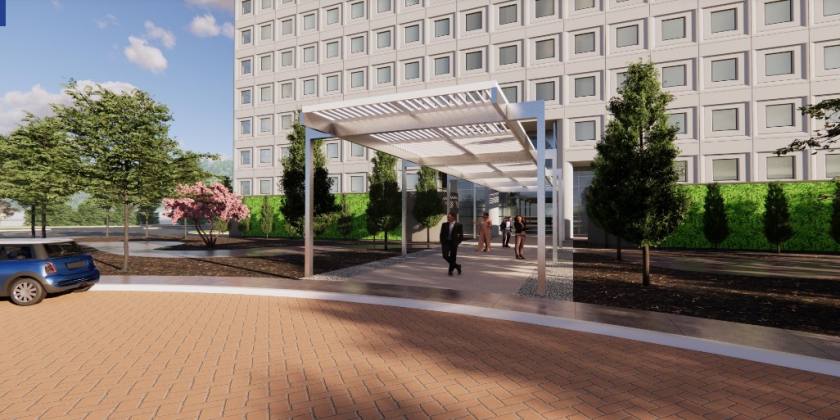
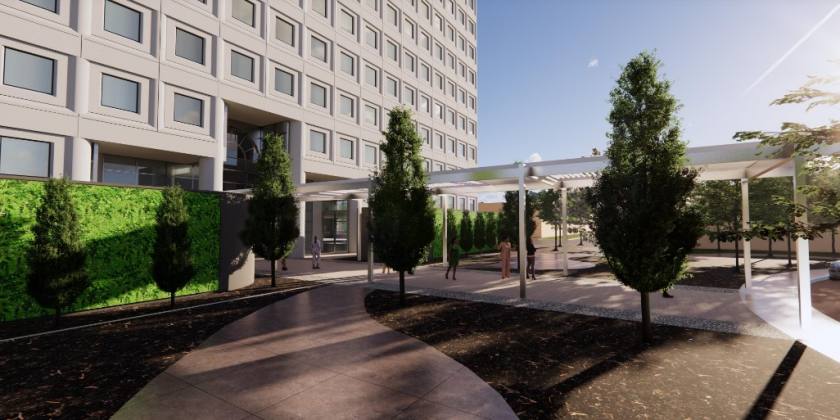
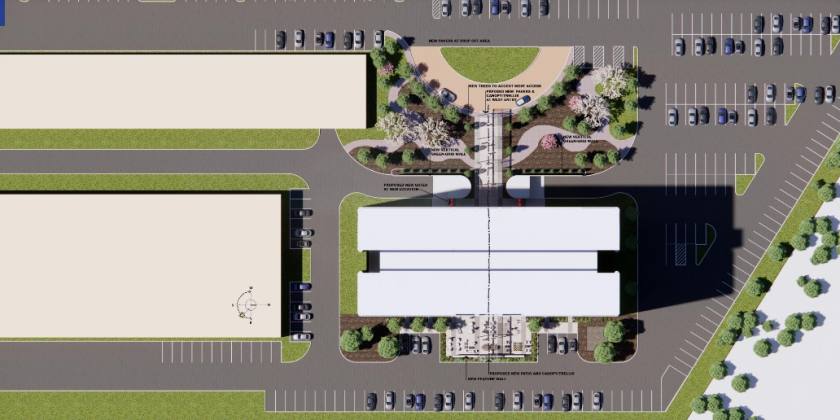
1-Mile | 3-Miles | 5-Miles | ||
---|---|---|---|---|
Total Population | 7,573 | 77,747 | 258,478 | |
Population Median Age | 44 | 42 | 42 | |
Population by Age | 0-9 Yrs | 854 (11%) | 9341 (12%) | 31011 (11%) |
10-19 Yrs | 887 (11%) | 9152 (11%) | 30133 (11%) | |
20-29 Yrs | 558 (7%) | 6483 (8%) | 22816 (8%) | |
30-39 Yrs | 931 (12%) | 9804 (12%) | 32758 (12%) | |
40-49 Yrs | 919 (12%) | 10395 (13%) | 34024 (13%) | |
50-59 Yrs | 1063 (14%) | 10570 (13%) | 35431 (13%) | |
60-69 Yrs | 983 (12%) | 10421 (13%) | 34438 (13%) | |
70+ Yrs | 1378 (18%) | 11581 (14%) | 37867 (14%) | |
Median HH Income | $90,060 | $98,978 | $93,212 | |
Total Household Income | < 24K | 313 (10%) | 3036 (10%) | 12443 (12%) |
25-49K | 602 (19%) | 4660 (15%) | 15602 (15%) | |
50-74K | 467 (15%) | 4533 (15%) | 14105 (14%) | |
75-99K | 241 (7%) | 2961 (9%) | 10740 (10%) | |
100-199K | 799 (26%) | 8960 (29%) | 28435 (28%) | |
200K+ | 631 (20%) | 5989 (19%) | 18624 (18%) | |
Highest Education Level | No Diploma | 445 | 4105 | 12813 |
Diploma or GED | 867 | 8683 | 31008 | |
Some College | 824 | 8506 | 28944 | |
Assoc. Degree | 310 | 3377 | 11373 | |
Bachelors Degree | 1519 | 17426 | 58131 | |
Higher Degree | 1545 | 14214 | 44251 | |
Total Housing Units | 3,388 | 32,171 | 105,909 | |
--Owner-Occupied | 2,047 | 21,850 | 74,499 | |
--Renter-Occupied | 1,006 | 8,288 | 25,450 | |
Owner-Occupied Values | < 100K | 80 | 921 | 3887 |
100-199K | 134 | 2419 | 11773 | |
200-299K | 215 | 2488 | 12793 | |
300-399K | 306 | 3762 | 14548 | |
400-499K | 317 | 3597 | 9820 | |
500K+ | 994 | 8662 | 21677 | |
Total Working Age Population | 6,200 | 62,988 | 208,908 | |
In Work Force | 3,847 | 40,670 | 134,994 | |
Not In Work Force | 2,353 | 22,318 | 73,914 | |
Workforce Employed | 3,698 | 39,545 | 129,866 | |
Workforce Unemployed | 97 | 1,062 | 4,985 | |
Civlian Workforce | 3,795 | 40,607 | 134,852 | |
Military Workforce | 52 | 64 | 142 | |
Total Households | 3,052 | 30,138 | 99,949 | |
Family Households | 2,095 | 20,969 | 69,950 | |
Non-Family Households | 957 | 9,170 | 29,999 | |
Married Couple | 1,733 | 17,580 | 58,133 | |
Other Family | 362 | 3,388 | 11,817 | |
Married w/Child | 633 | 6,780 | 23,214 | |
Single Male w/Child | 14 | 392 | 1,405 | |
Single Female w/Child | 116 | 958 | 3,615 |
Population Change Last Two Decades - Plus Projection
2000 | % | 2010 | % | 2020 | % | 2030 | |
---|---|---|---|---|---|---|---|
Illinois | 12,419,293 | +3 | 12,830,632 | +12 | 14,316,487 | +6 | 15,138,849 |
Cook County | 5,376,741 | -3 | 5,194,675 | +10 | 5,707,832 | +5 | 5,990,243 |
Lake County | 644,356 | +9 | 703,462 | +17 | 820,250 | +6 | 873,024 |
Total Working Age Population:
Total Households:
Total Working Age Population:
Total Households:
Total Working Age Population:
Total Households: