Specialty Real Estate
4030 South 1100 West Hurricane, UT 84737
4030 South 1100 West Hurricane, UT 84737
Details & Description
Property Highlights
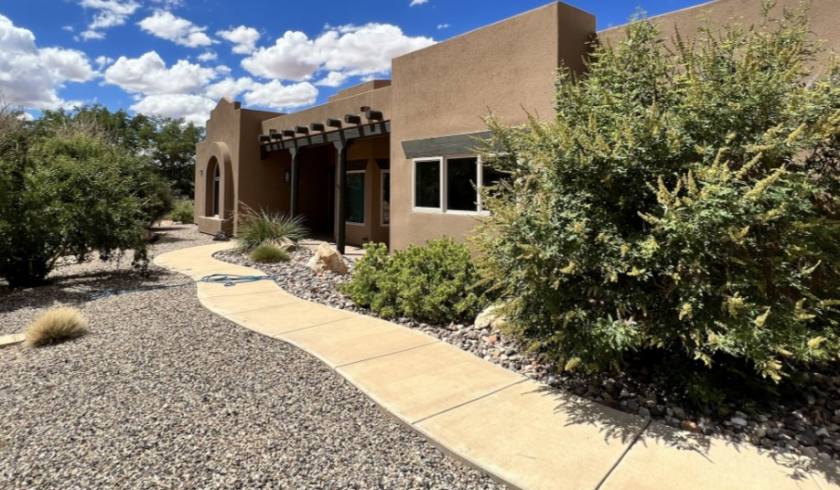
- • 2,000sf+ Residence
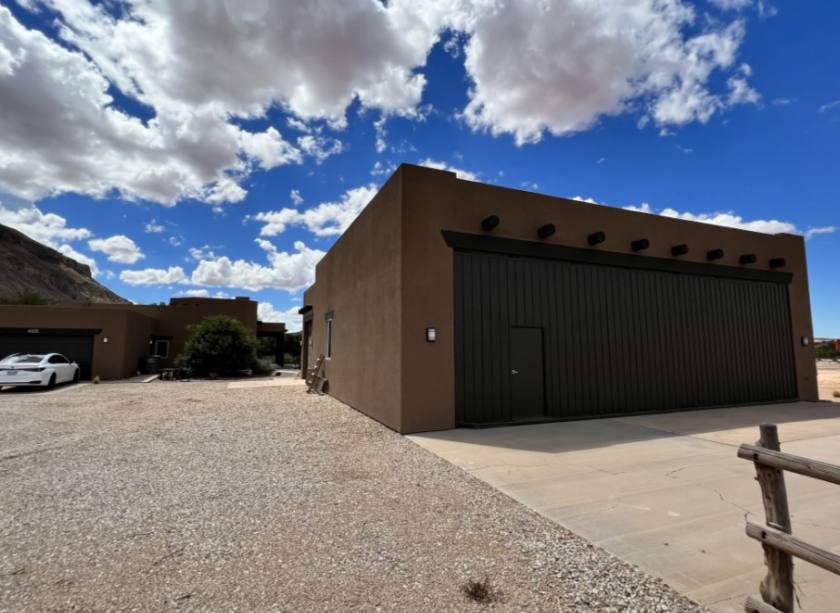
- • 2,000sf+ Hangar
- • Adjacent to runway
Listing Agents

Tom Callister
O: 435-359-4902
tom@linxcre.com
O: 435-359-4902
tom@linxcre.com
While we strive to provide the most accurate information, all listing information, and demographic data, is provided by third-parties. As such, MyEListing will not be responsible for the accuracy of the information. It is strongly recommended that you verify all information with the listing agent, and any relevant agencies, prior to making any decisions.