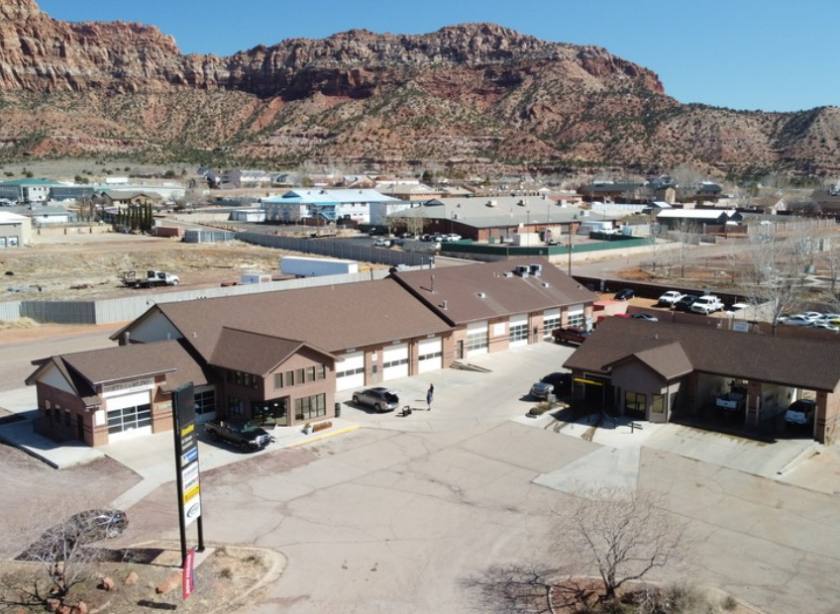
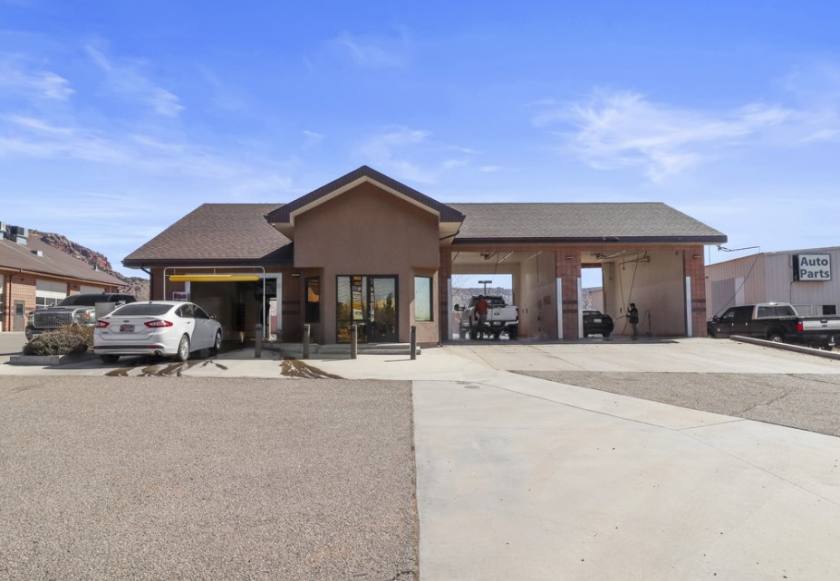
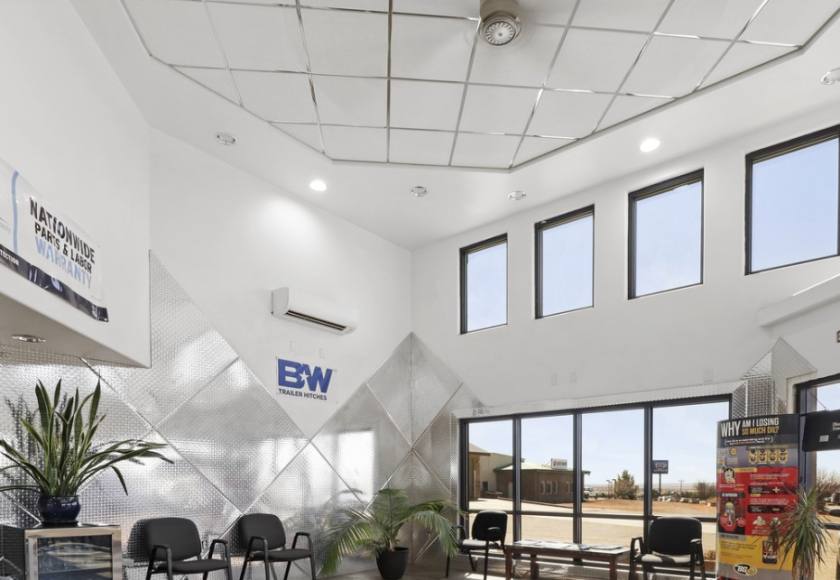
Retail Space
680 North State Street Hildale, UT 84784
680 North State Street Hildale, UT 84784
Details & Description
Property Highlights
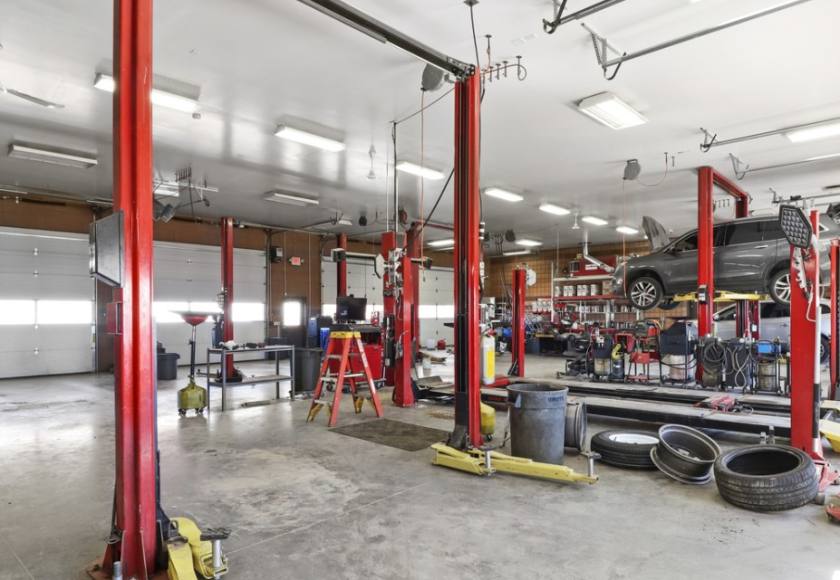
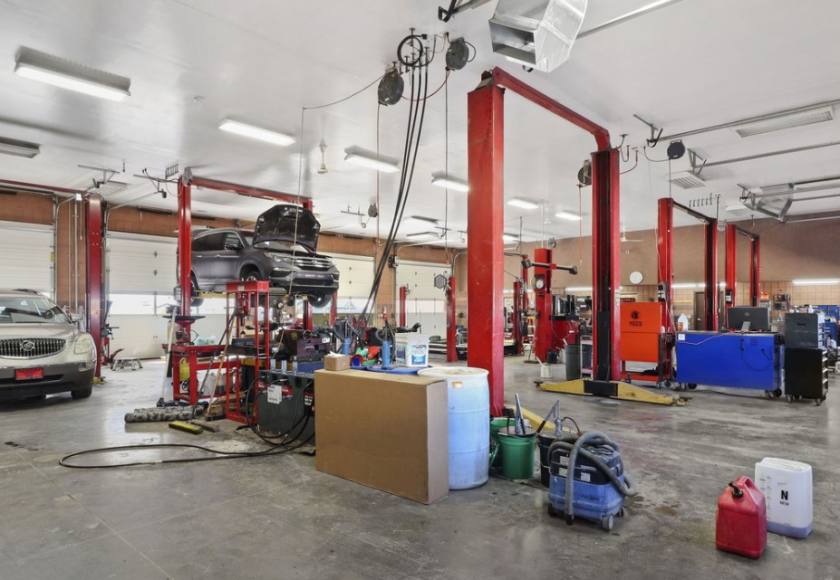
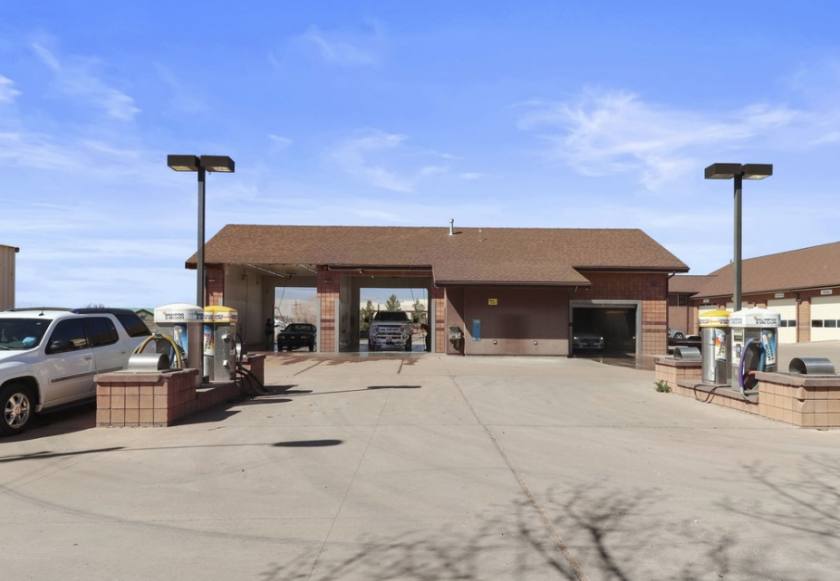
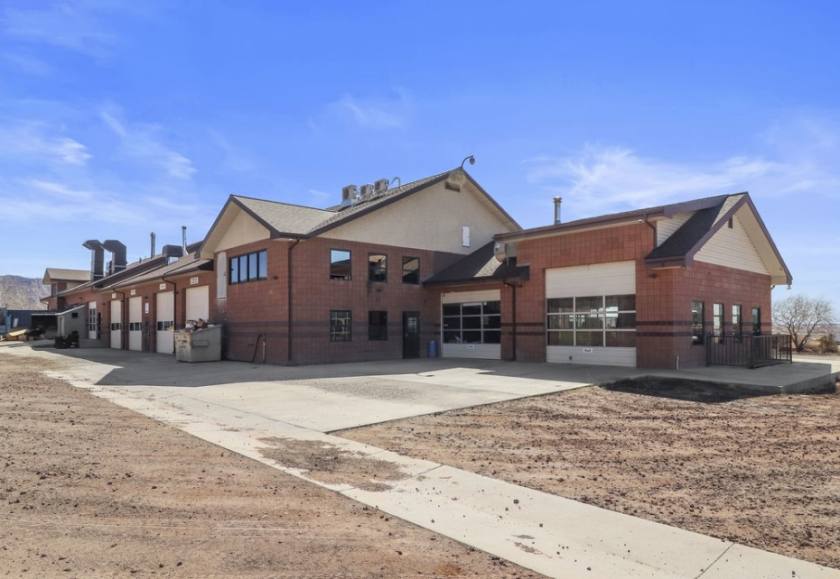
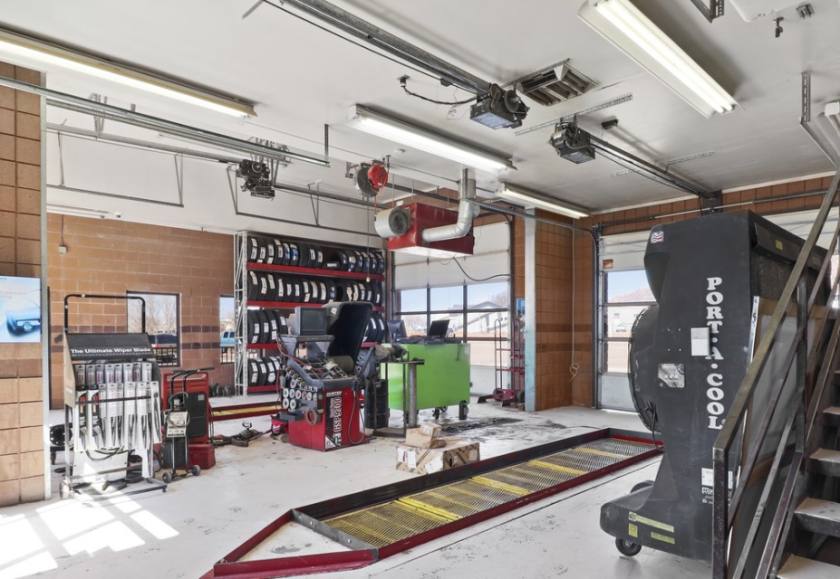
- • 8 bay mechanical shop
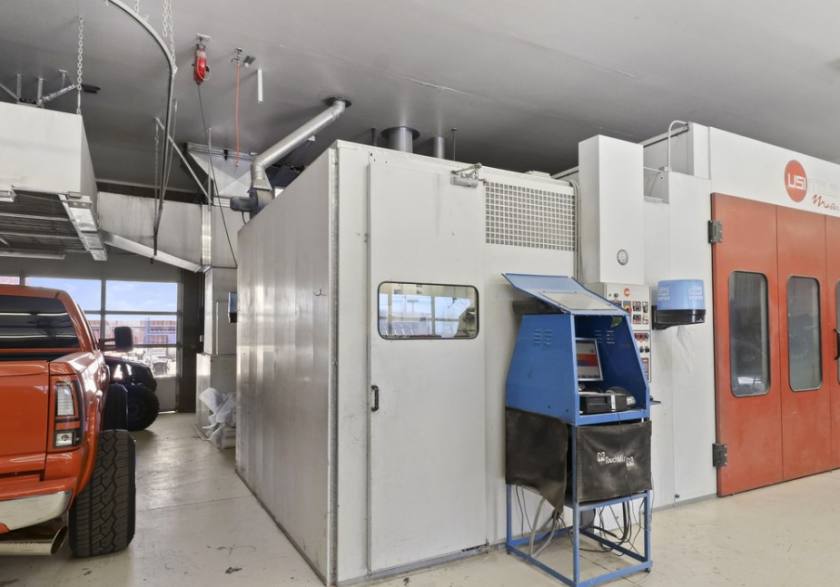
- • 4 bay auto body shop
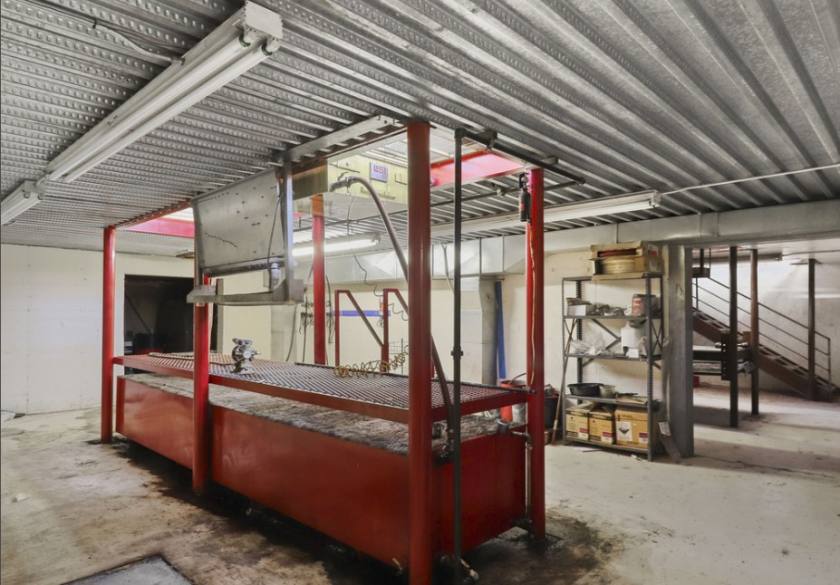
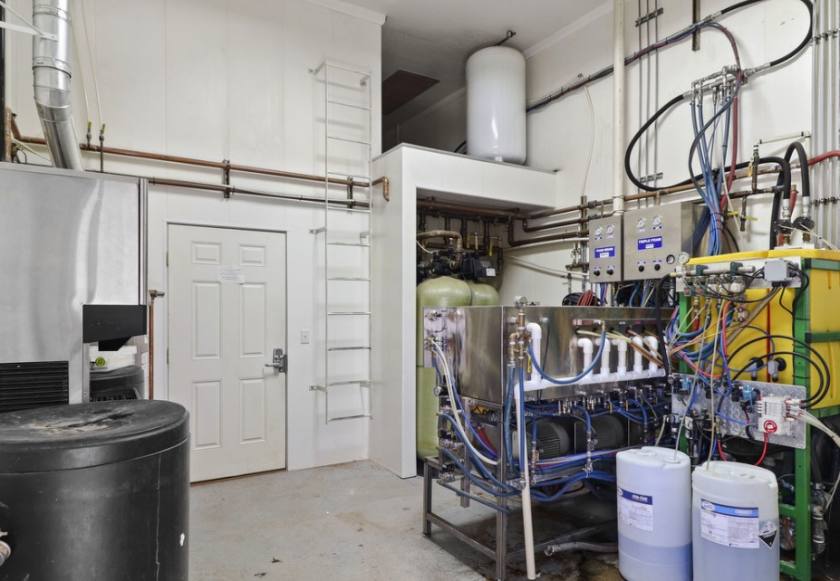
- • 2 bay quick lube with oil pits
- • 2-2,000 gallon, 1-800 gallon oil storage tanks
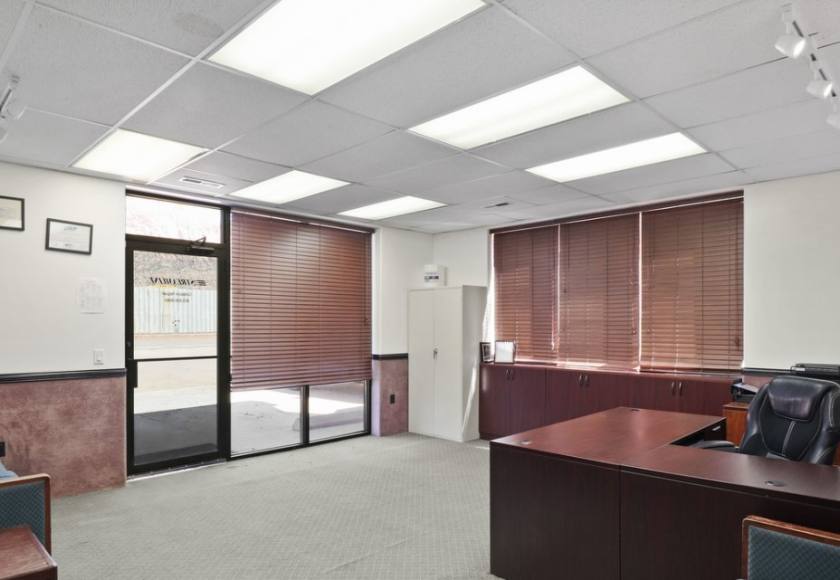
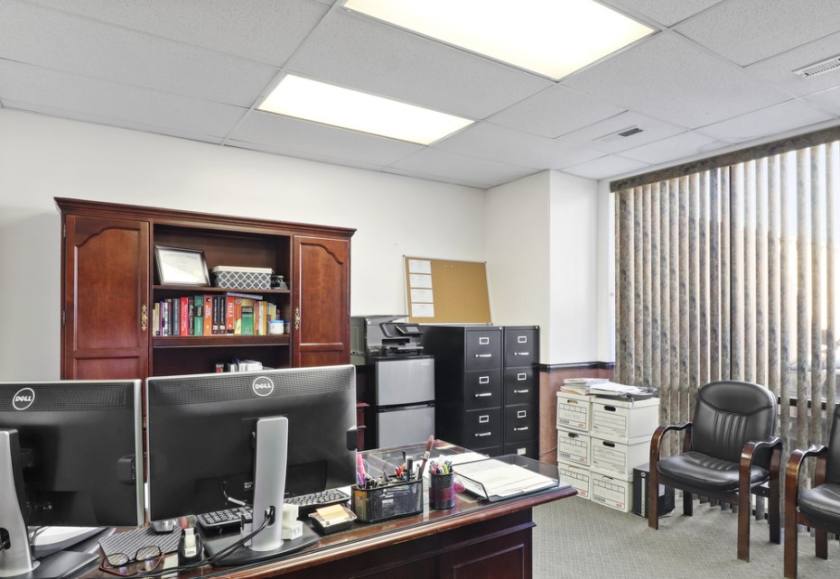
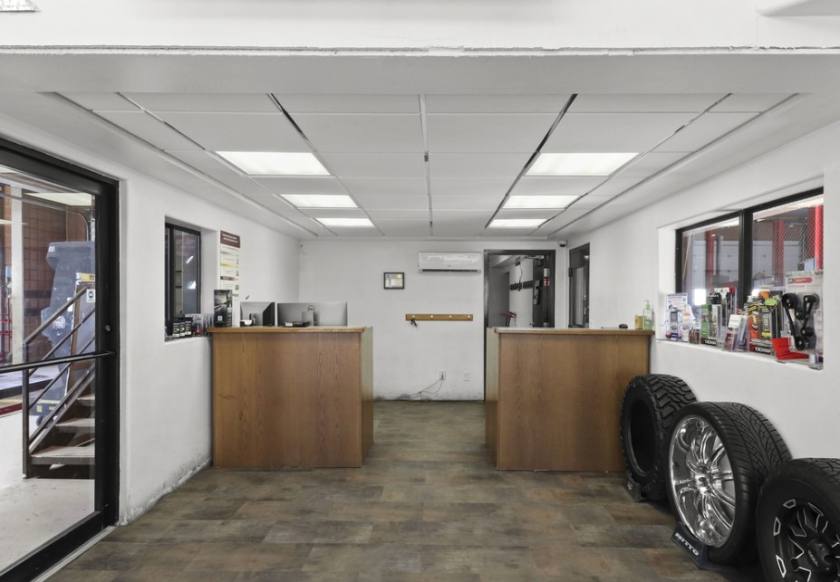
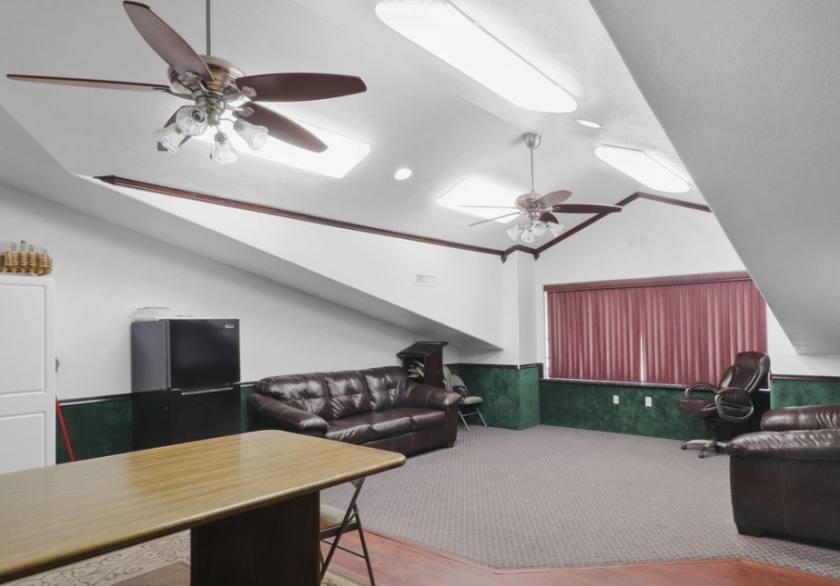
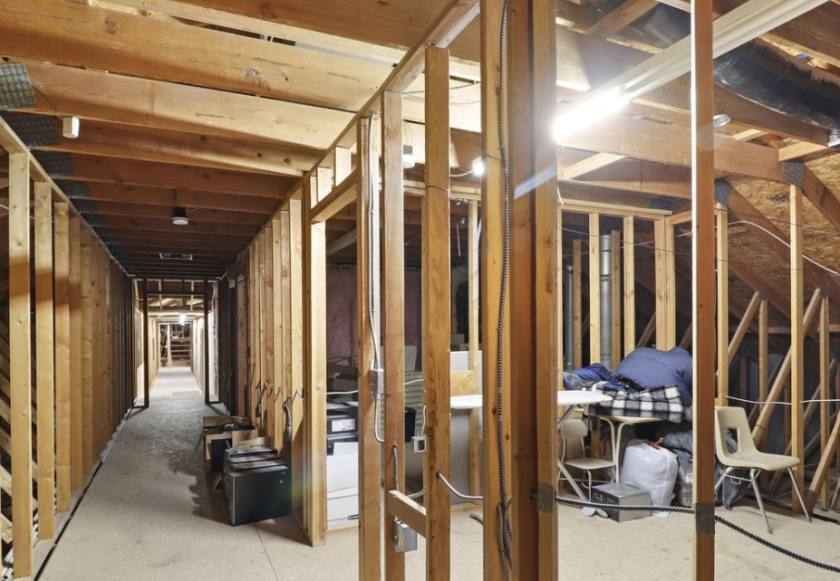
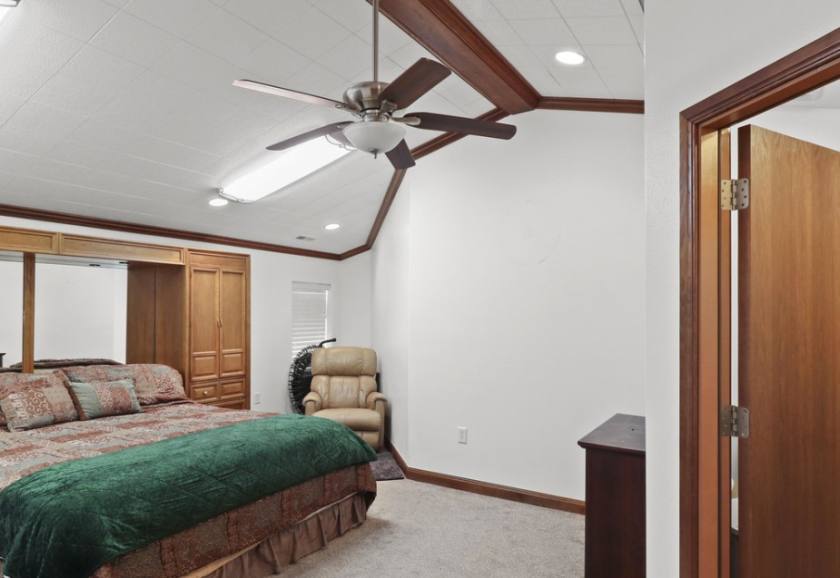
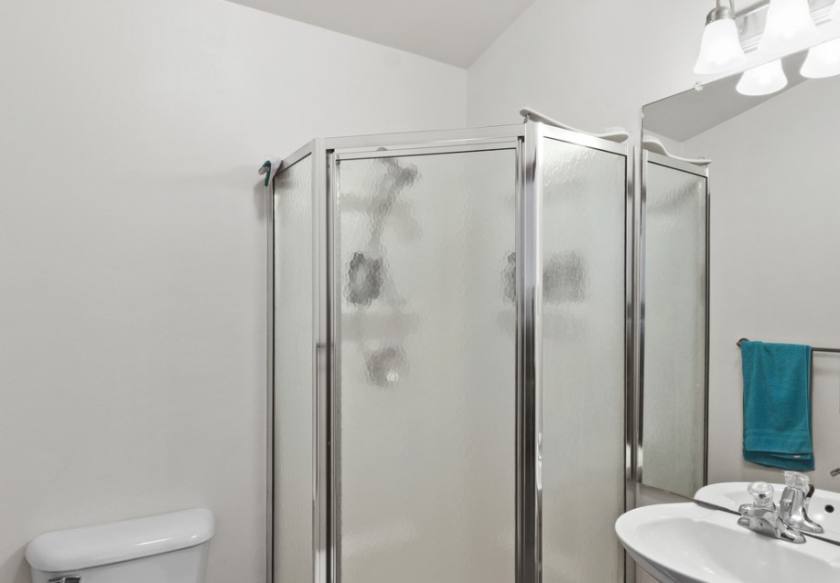
Additional Photos
Listing Agents

Travis Parry
O: 435-359-4901
travis@linxcre.com
O: 435-359-4901
travis@linxcre.com
While we strive to provide the most accurate information, all listing information, and demographic data, is provided by third-parties. As such, MyEListing will not be responsible for the accuracy of the information. It is strongly recommended that you verify all information with the listing agent, and any relevant agencies, prior to making any decisions.