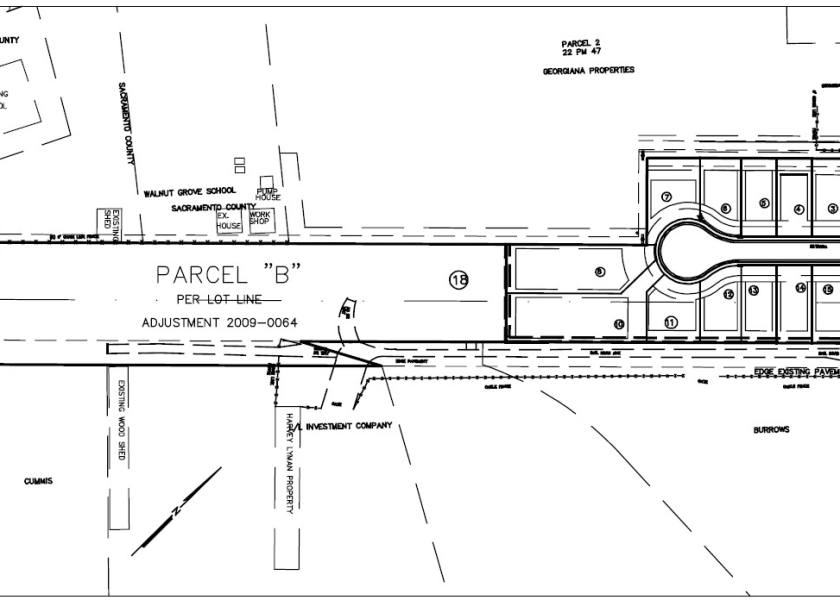
1-Mile | 3-Miles | 5-Miles | ||
---|---|---|---|---|
Total Population | 158 | 921 | 2,692 | |
Population Median Age | 38 | 40 | 39 | |
Population by Age | 0-9 Yrs | 25 (15%) | 125 (13%) | 343 (12%) |
10-19 Yrs | 20 (12%) | 120 (13%) | 360 (13%) | |
20-29 Yrs | 23 (14%) | 125 (13%) | 387 (14%) | |
30-39 Yrs | 17 (10%) | 92 (9%) | 307 (11%) | |
40-49 Yrs | 16 (10%) | 93 (10%) | 293 (10%) | |
50-59 Yrs | 21 (13%) | 119 (12%) | 338 (12%) | |
60-69 Yrs | 23 (14%) | 141 (15%) | 376 (13%) | |
70+ Yrs | 14 (8%) | 106 (11%) | 289 (10%) | |
Median HH Income | $57,701 | $58,541 | $58,080 | |
Total Household Income | < 24K | 6 (11%) | 40 (12%) | 130 (14%) |
25-49K | 12 (22%) | 72 (22%) | 199 (22%) | |
50-74K | 16 (30%) | 94 (29%) | 244 (27%) | |
75-99K | 5 (9%) | 31 (9%) | 81 (9%) | |
100-199K | 9 (16%) | 54 (17%) | 146 (16%) | |
200K+ | 4 (7%) | 27 (8%) | 72 (8%) | |
Highest Education Level | No Diploma | 10 | 76 | 282 |
Diploma or GED | 31 | 166 | 486 | |
Some College | 27 | 174 | 493 | |
Assoc. Degree | 6 | 44 | 135 | |
Bachelors Degree | 26 | 147 | 381 | |
Higher Degree | 10 | 54 | 131 | |
Total Housing Units | 63 | 388 | 1,062 | |
--Owner-Occupied | 30 | 194 | 522 | |
--Renter-Occupied | 23 | 124 | 350 | |
Owner-Occupied Values | < 100K | 1 | 13 | 43 |
100-199K | 1 | 9 | 27 | |
200-299K | 1 | 17 | 53 | |
300-399K | 2 | 15 | 48 | |
400-499K | 5 | 30 | 79 | |
500K+ | 19 | 108 | 272 | |
Total Working Age Population | 120 | 725 | 2,141 | |
In Work Force | 75 | 436 | 1,219 | |
Not In Work Force | 45 | 288 | 923 | |
Workforce Employed | 70 | 407 | 1,130 | |
Workforce Unemployed | 5 | 30 | 88 | |
Civlian Workforce | 75 | 436 | 1,219 | |
Military Workforce | 0 | 0 | 0 | |
Total Households | 53 | 317 | 872 | |
Family Households | 47 | 265 | 717 | |
Non-Family Households | 6 | 52 | 155 | |
Married Couple | 41 | 227 | 597 | |
Other Family | 6 | 38 | 120 | |
Married w/Child | 17 | 87 | 231 | |
Single Male w/Child | 0 | 3 | 12 | |
Single Female w/Child | 3 | 12 | 38 |
Population Change Last Two Decades - Plus Projection
2000 | % | 2010 | % | 2020 | % | 2030 | |
---|---|---|---|---|---|---|---|
California | 33,871,648 | +10 | 37,253,956 | +9 | 40,467,295 | +8 | 43,631,295 |
Sacramento County | 1,223,499 | +16 | 1,418,788 | +11 | 1,572,195 | +12 | 1,758,565 |
San Joaquin County | 563,598 | +22 | 685,306 | +14 | 780,750 | +14 | 889,779 |
Solano County | 394,542 | +5 | 413,344 | +9 | 449,432 | +11 | 499,633 |
Total Working Age Population:
Total Households:
Total Working Age Population:
Total Households:
Total Working Age Population:
Total Households: