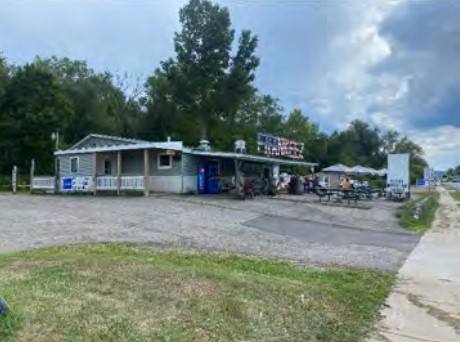
Retail Space
100 South Main Street Franklinville, NY 14737
100 South Main Street Franklinville, NY 14737
Details & Description
Property Highlights
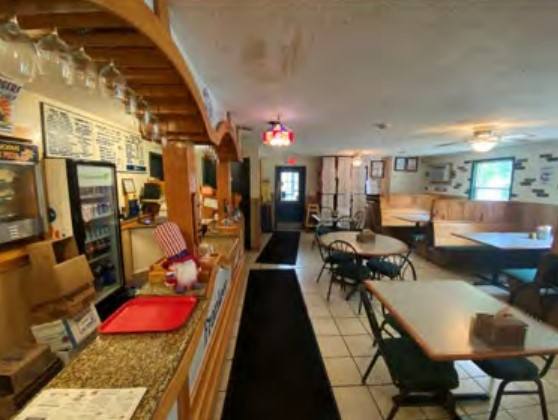
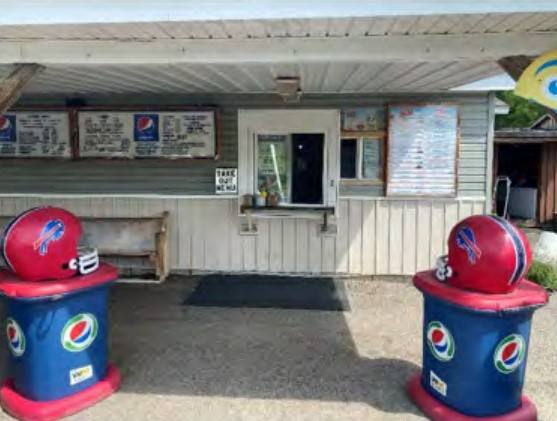
- • Indoor seating: 40 + Outdoor seating: 40 +
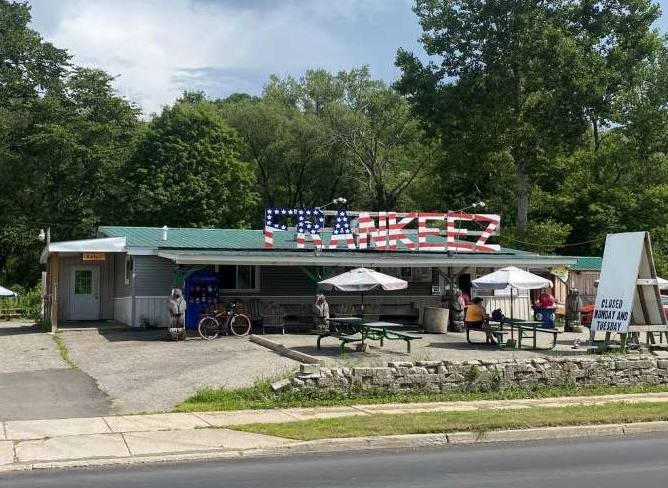
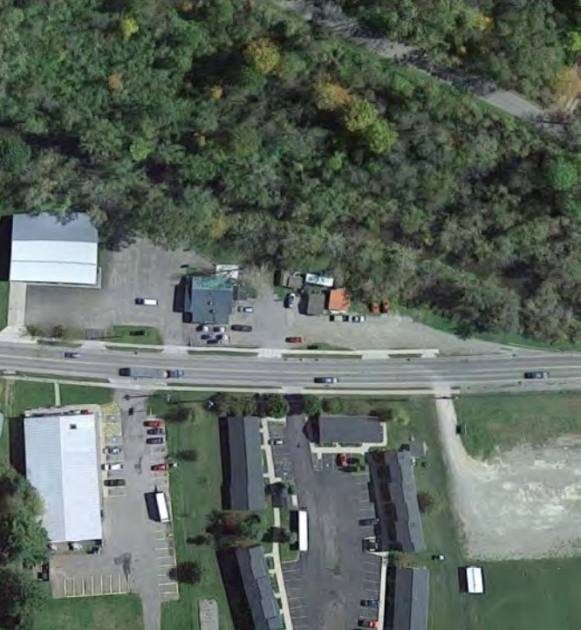
- • Highly visible location on welltraveled Route 16
- • Ample parking on-site
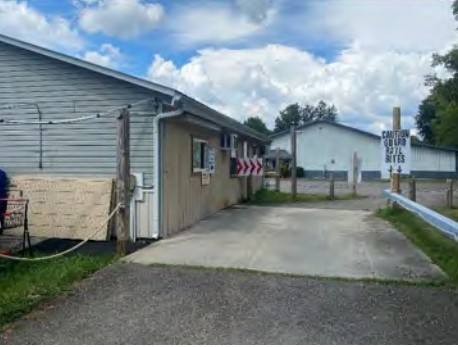
- • Drive-thru
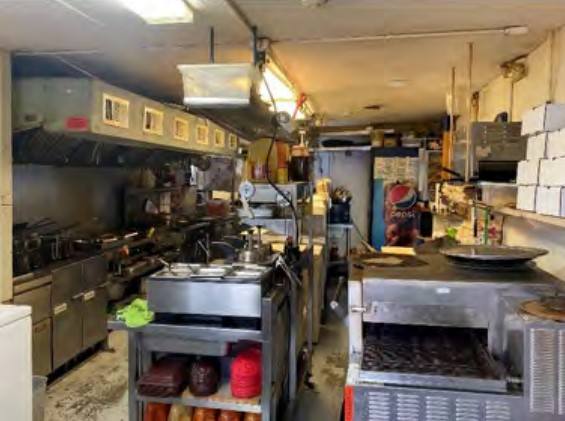
- • Full hood / Ansul / makeup air system
Additional Photos
Listing Agents

John Hawkins
O: 716-852-7500
M: 716-213-3638
JHawkins@pyramidbrokerage.com
O: 716-852-7500
M: 716-213-3638
JHawkins@pyramidbrokerage.com

David P. Seider
O: 716-852-7500
M: 716-570-9086
dseider@pyramidbrokerage.com
O: 716-852-7500
M: 716-570-9086
dseider@pyramidbrokerage.com
While we strive to provide the most accurate information, all listing information, and demographic data, is provided by third-parties. As such, MyEListing will not be responsible for the accuracy of the information. It is strongly recommended that you verify all information with the listing agent, and any relevant agencies, prior to making any decisions.