99 acres with potential for 75 one acre home sites
15 minutes from new Samsung plant in Taylor
Many heritage oak trees on property
Minutes to downtown Coupland
Coupland ISD
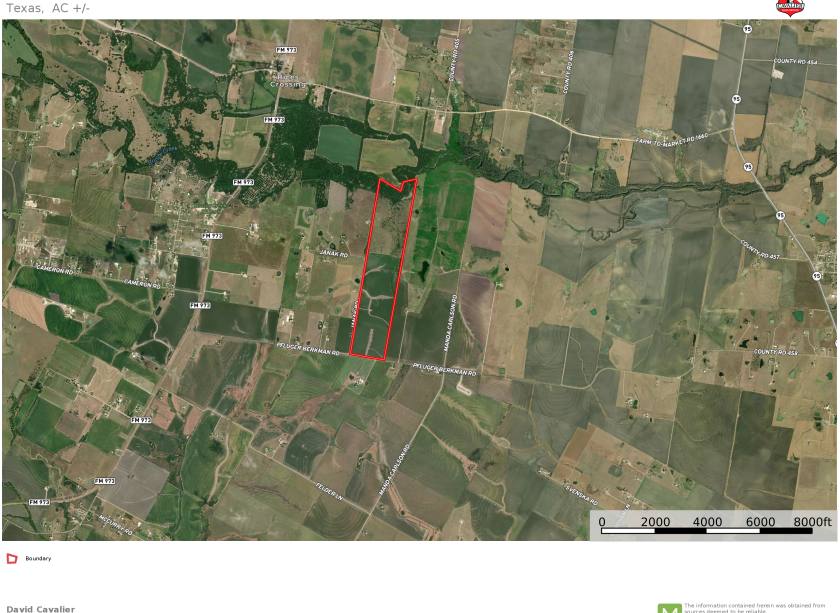
Located in the rolling hills of Coupland, Texas, just 40 minutes northeast of Austin and 10 minutes south of Taylor, Coupland Ranch is close enough for convenience yet far enough for peace and quiet. Phase 2 at Coupland Ranch will be a residential community of approximately 75 one acre home sites on 99 acres in an exclusive gated setting. Amenities will include:
Creek with fishing dock
Park area with Brushy Creek access
All lot owners will have Brushy Creek access
Coupland Ranch is surrounded by ranch land, yet is close to many national retail, restaurant, entertainment and employment centers.
Within 15 minutes of new Taylor Samsung plant
Within 45 minutes of Austin Bergstrom Airport
Located in acclaimed Coupland ISD
Just minutes from the downtown Taylor
Proximity to Hwy 95, FM 973 & FM 1660
Minutes to downtown Coupland
There are heritage oak and hardwood trees disbursed among the property. Our gated community, peaceful location, Brushy Creek frontage and amazing natural amenities make Coupland Ranch a great place to call home!
www.couplandranch.com
No part of this information may be copied, reproduced, repurposed, or screen-captured for any commercial purpose without prior written authorization from MyEListing.
While we strive to provide the most accurate information, all listing information, and demographic data, is provided by third-parties. As such, MyEListing will not be responsible for the accuracy of the information. It is strongly recommended that you verify all information with the listing agent, and any relevant agencies, prior to making any decisions.
What is the asking price for 19711 Janak Road in Coupland?
The asking price for 19711 Janak Road is $6,435,000
How much land does the Coupland, TX property at 19711 Janak Road include?
19711 Janak Road in Coupland includes 99.000 acres of land
What is the population within 1 mile of 19711 Janak Road in Coupland?
The population within 1 mile of 19711 Janak Road Coupland, TX 78615 is 166 people.
Who do I contact for questions about 19711 Janak Road?
You should contact the listing agent,
David Cavalier, for any details regarding this commercial listing.