Commercial Land
1001 Farm to Market 969 Bastrop, TX 78602
1001 Farm to Market 969 Bastrop, TX 78602

Details & Description
Property Highlights
• SpaceX & The Boring Company building 500,000 SF office building less than 1 mile from site
• Public sewer coming to area. Can re-plat site for 300+ duplex units
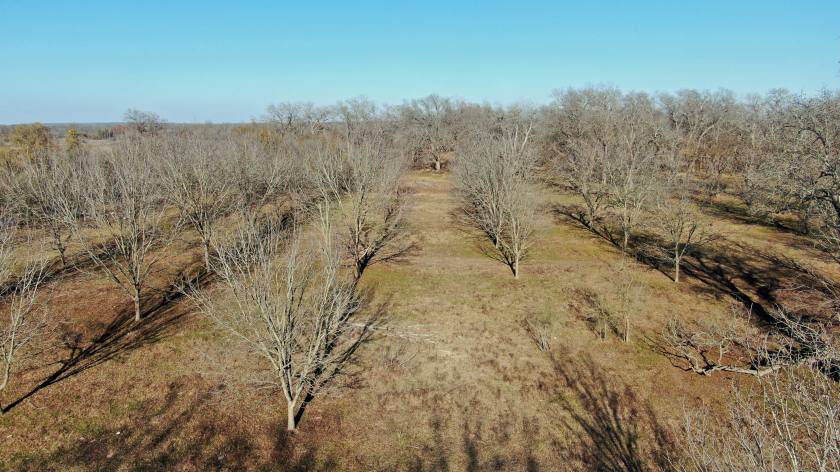
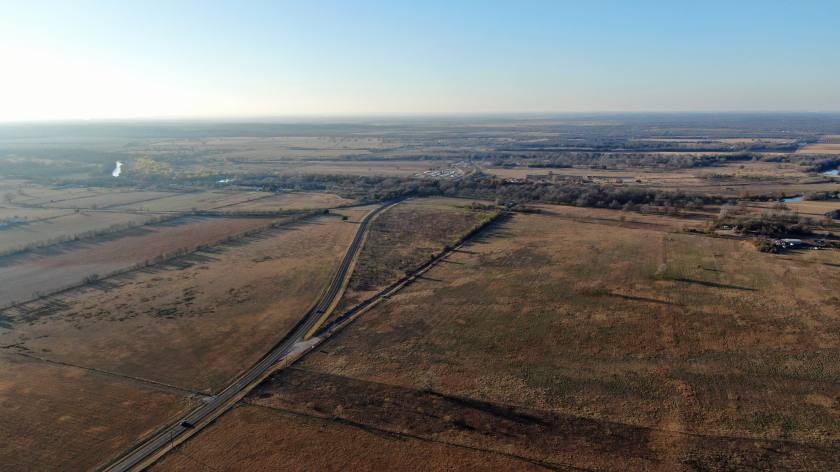
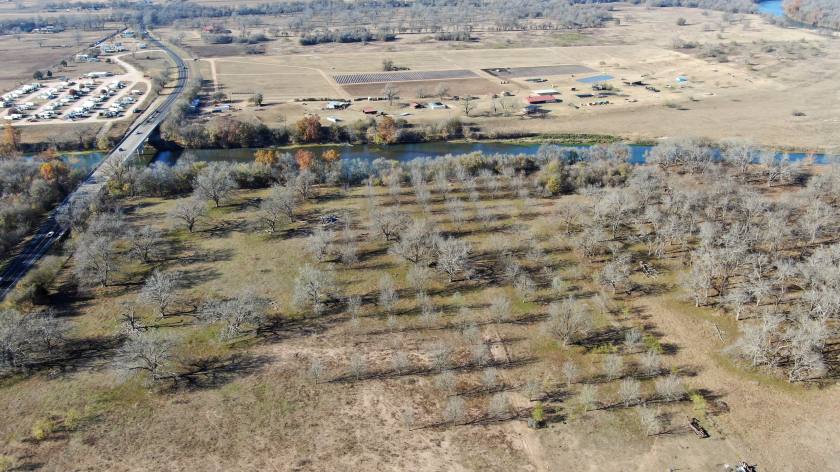
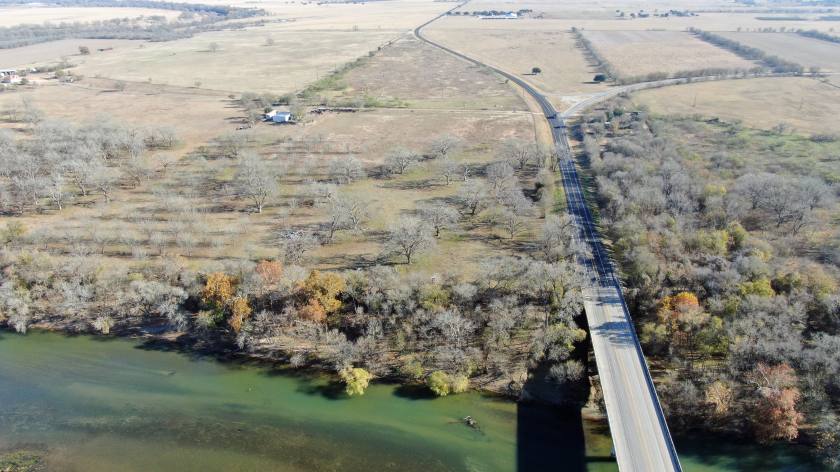
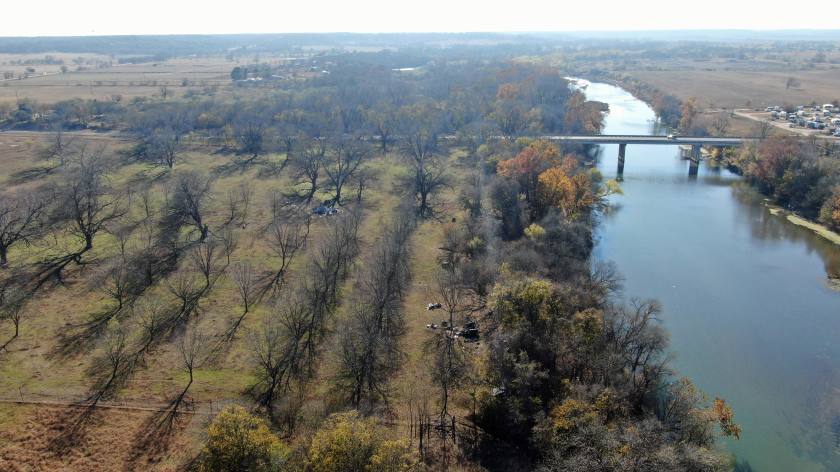
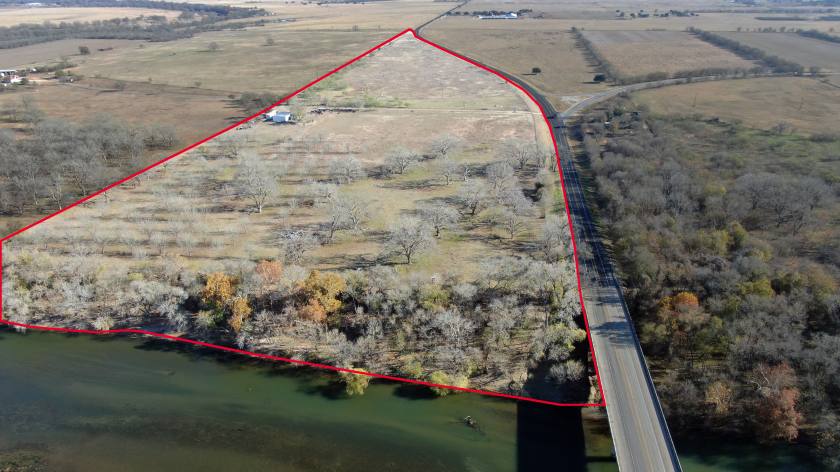
Additional Photos

Listing Agents

David Cavalier
O: 512-656-5787
dpcavalier@earthlink.net
O: 512-656-5787
dpcavalier@earthlink.net
While we strive to provide the most accurate information, all listing information, and demographic data, is provided by third-parties. As such, MyEListing will not be responsible for the accuracy of the information. It is strongly recommended that you verify all information with the listing agent, and any relevant agencies, prior to making any decisions.