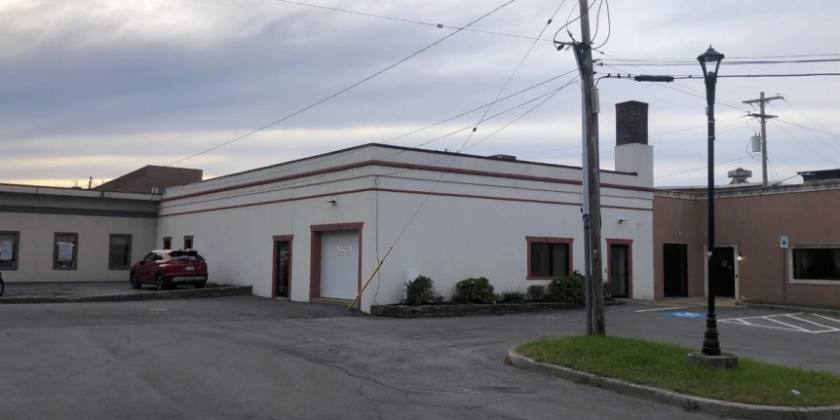
Office Space
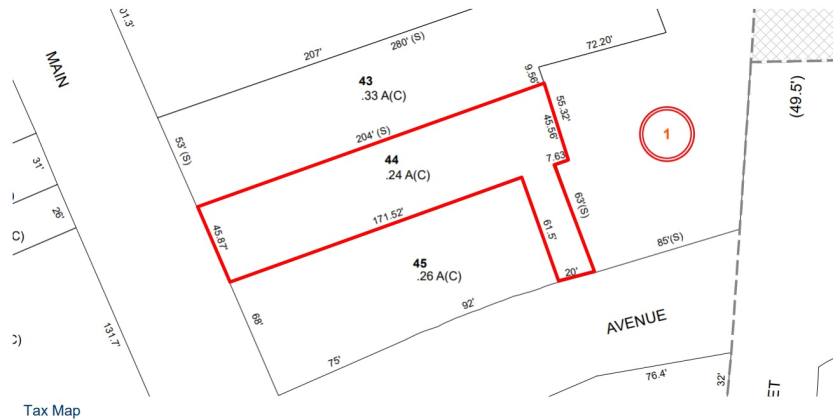
169 Main Street Oneida, NY 13421
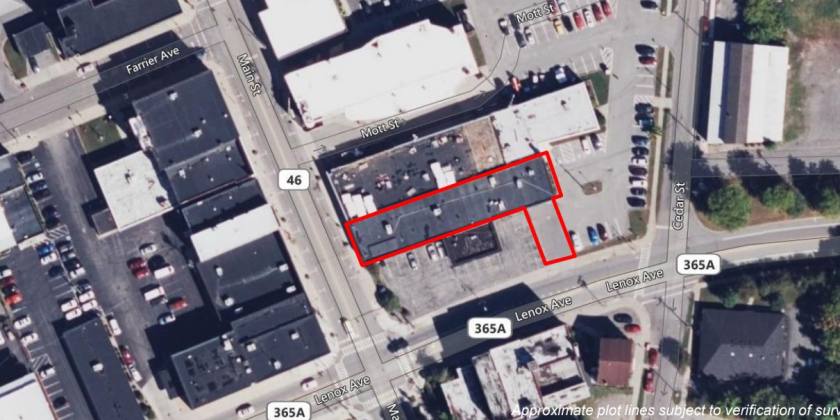
169 Main Street Oneida, NY 13421

Details & Description
Property Highlights
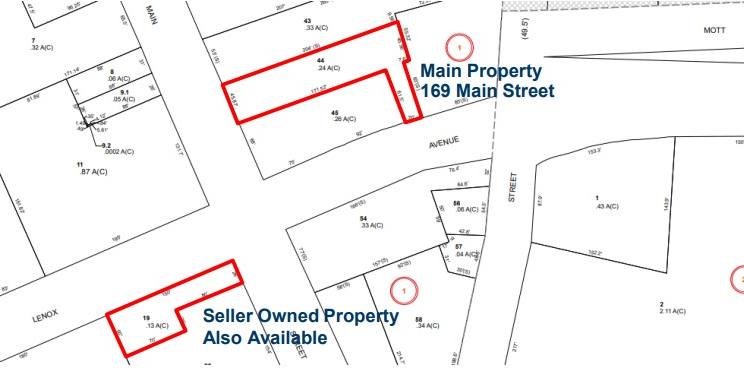
• Can be combined with 0.13± acre lot on the corner of Lenox Avenue and Main Street
• Public parking and delivery door in rear
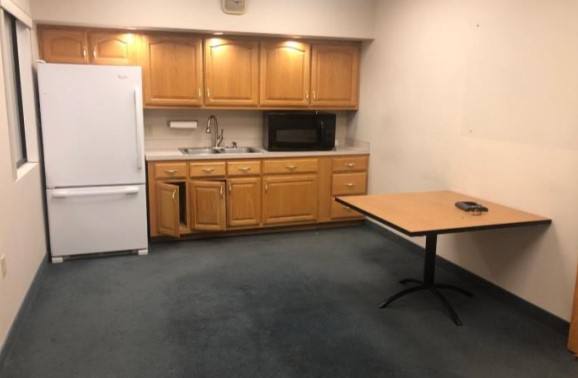
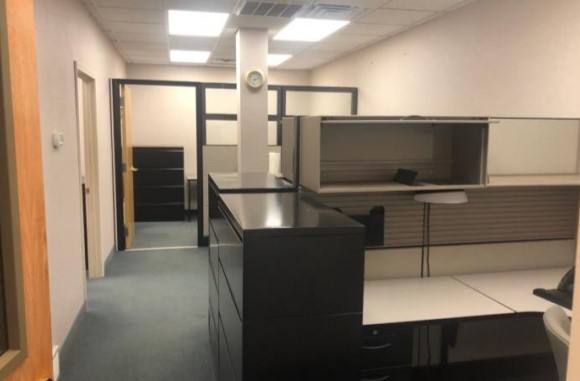
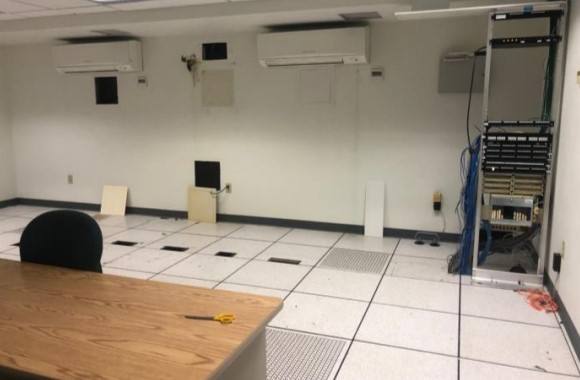
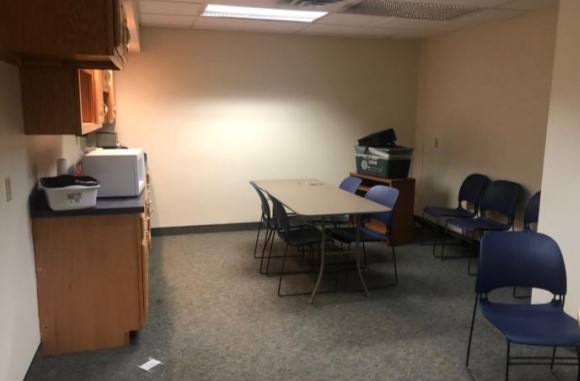
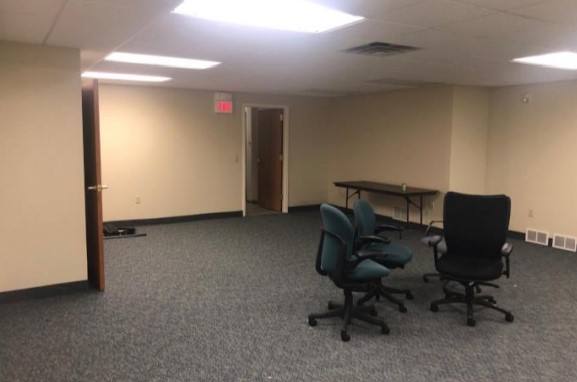
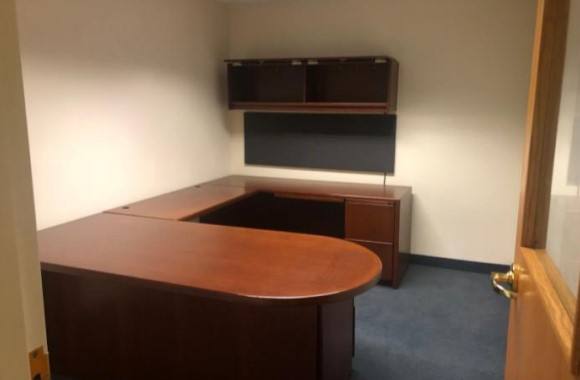
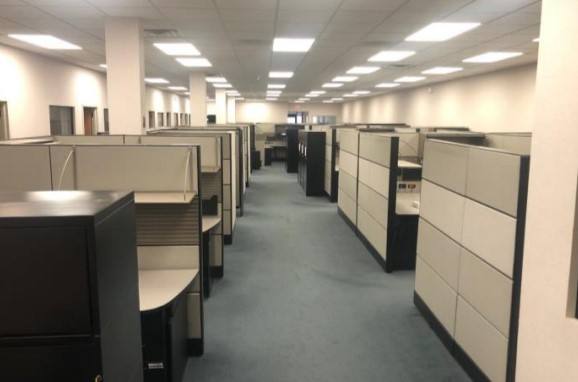
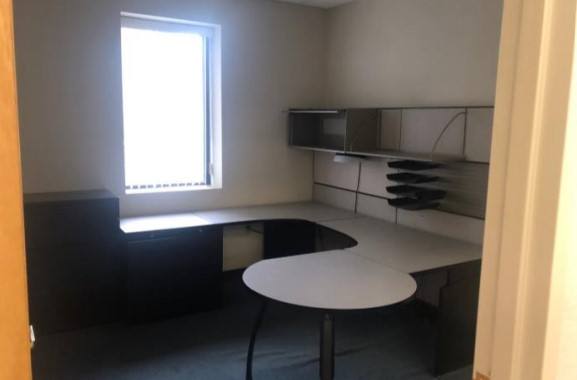
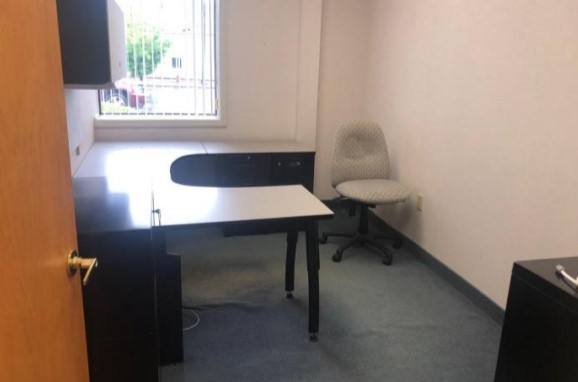
Additional Photos

Listing Agents

Peter Catalano
O: 315-445-8537
M: 315-430-9745
pcatalano@pyramidbrokerage.com
O: 315-445-8537
M: 315-430-9745
pcatalano@pyramidbrokerage.com

Joyce M. MacKnight
O: 315-445-8514
M: 315-727-5002
jmacknight@pyramidbrokerage.com
O: 315-445-8514
M: 315-727-5002
jmacknight@pyramidbrokerage.com
While we strive to provide the most accurate information, all listing information, and demographic data, is provided by third-parties. As such, MyEListing will not be responsible for the accuracy of the information. It is strongly recommended that you verify all information with the listing agent, and any relevant agencies, prior to making any decisions.