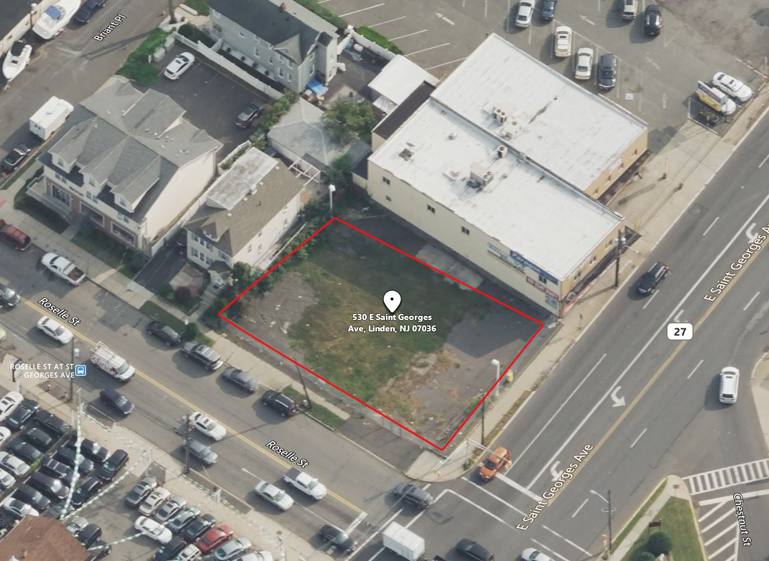
Lot Size at ±0.21 Acres (Block 163, Lot 5)
Commercial Use
80’ x 113’ Lot Dimensions
Taxes at $9,283.86 (2022)
Across from Bus Stop (NJ Transit Bus 48, 94 and 115)
Corner Lot Intersection with Traffic Light Along Busy E Saint Georges Avenue
Approx. 1.9 Miles to Garden State Parkway Exit 136
Approx. 3.3 Miles to I-278
Approx. 8.8 Miles to Newark Liberty International Airport
No part of this information may be copied, reproduced, repurposed, or screen-captured for any commercial purpose without prior written authorization from MyEListing.
While we strive to provide the most accurate information, all listing information, and demographic data, is provided by third-parties. As such, MyEListing will not be responsible for the accuracy of the information. It is strongly recommended that you verify all information with the listing agent, and any relevant agencies, prior to making any decisions.
What is the asking price for 530 East Saint Georges Avenue in Linden?
The asking price for 530 East Saint Georges Avenue is $595,000
How much land does the Linden, NJ property at 530 East Saint Georges Avenue include?
530 East Saint Georges Avenue in Linden includes 0.210 acres of land
What kind of Land is the propery at 530 East Saint Georges Avenue?
The property at 530 East Saint Georges Avenue Linden, NJ 07036 is listed as a Mixed Use Land Land property
What is the population within 1 mile of 530 East Saint Georges Avenue in Linden?
The population within 1 mile of 530 East Saint Georges Avenue Linden, NJ 07036 is 32,056 people.
Who do I contact for questions about 530 East Saint Georges Avenue?
You should contact the listing agent,
Jason M. Crimmins , for any details regarding this commercial listing.