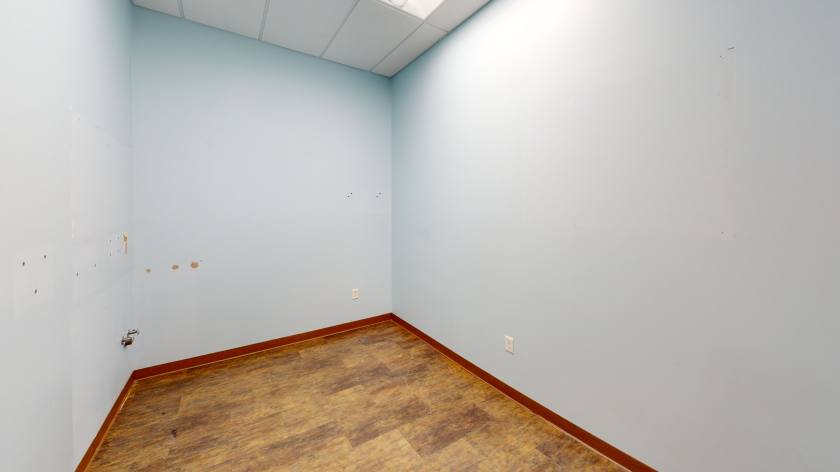
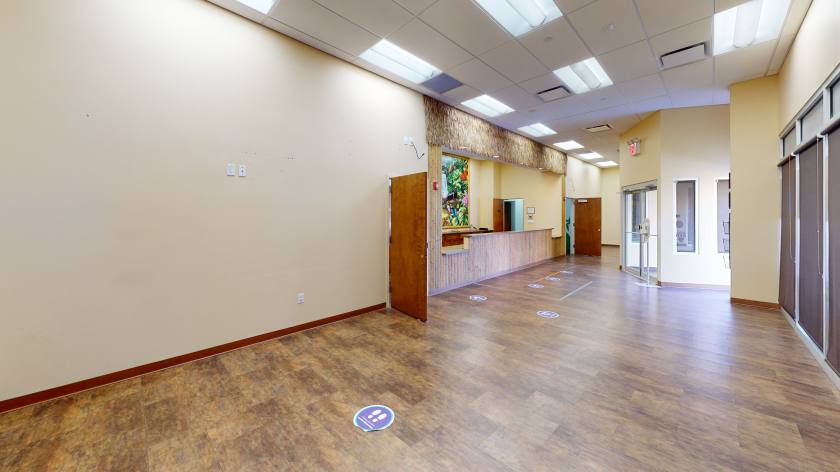
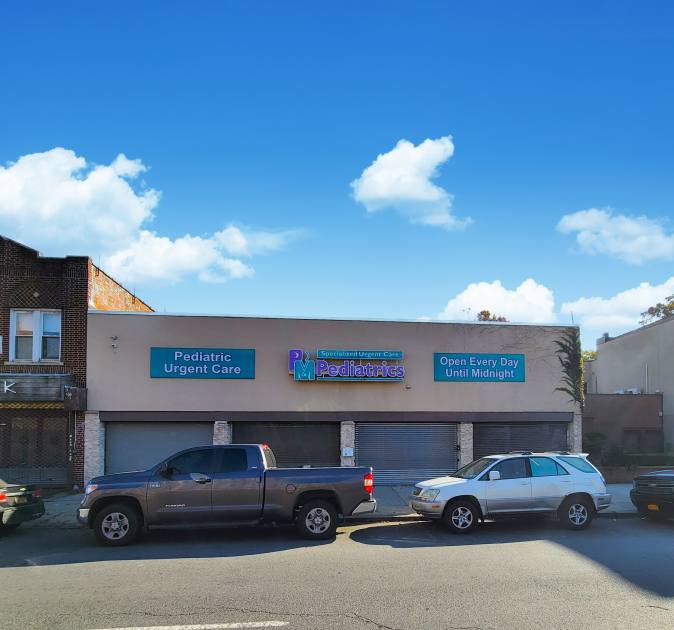
Office Space
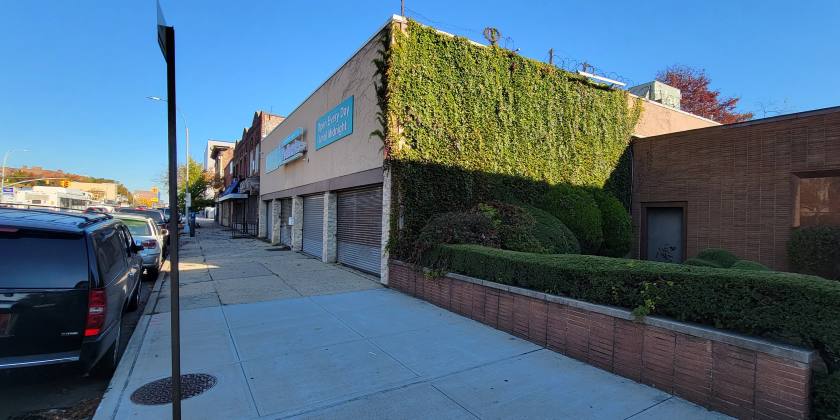
1273 Coney Island Avenue Brooklyn, NY 11230
1273 Coney Island Avenue Brooklyn, NY 11230
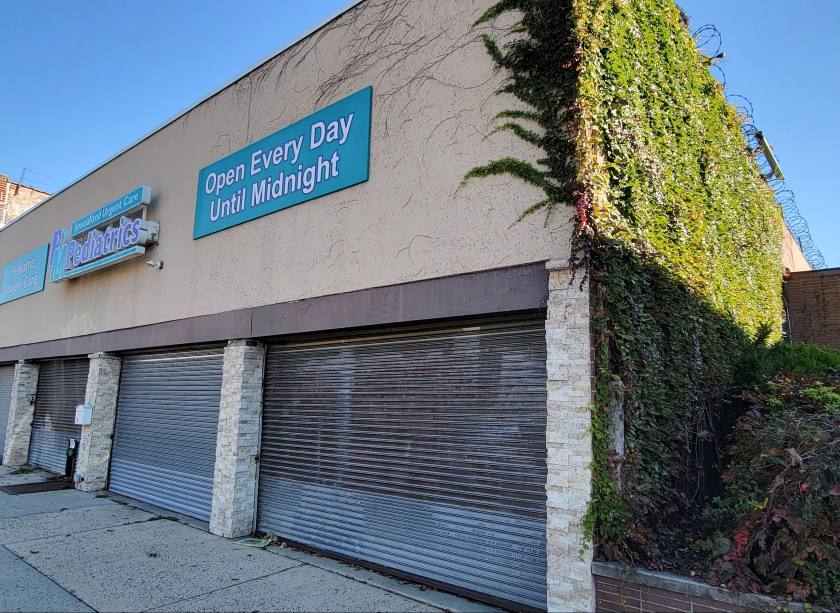
Details & Description
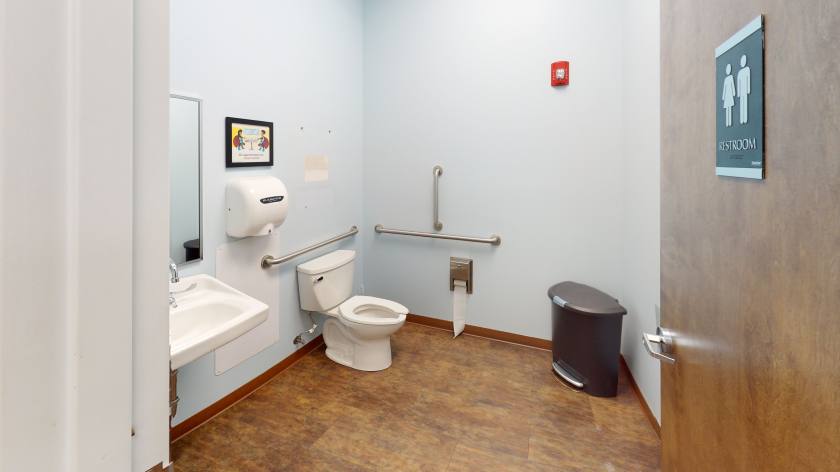
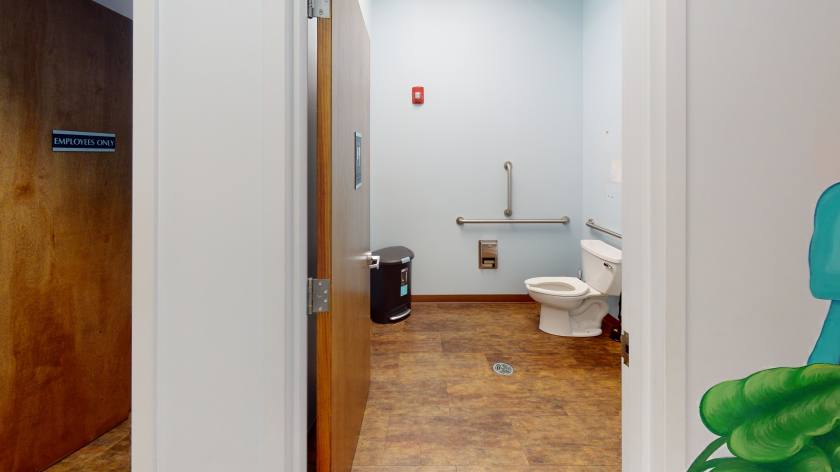
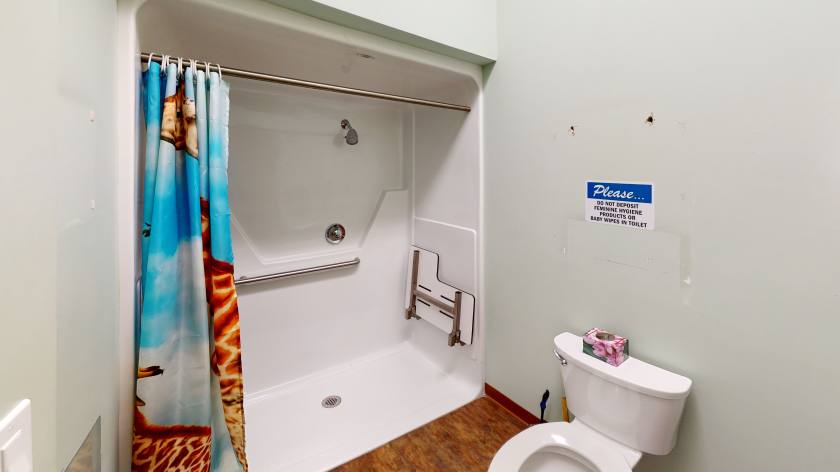
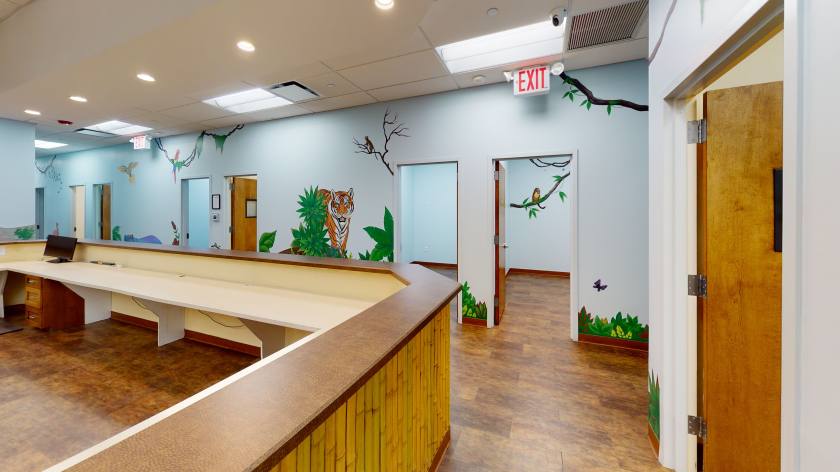
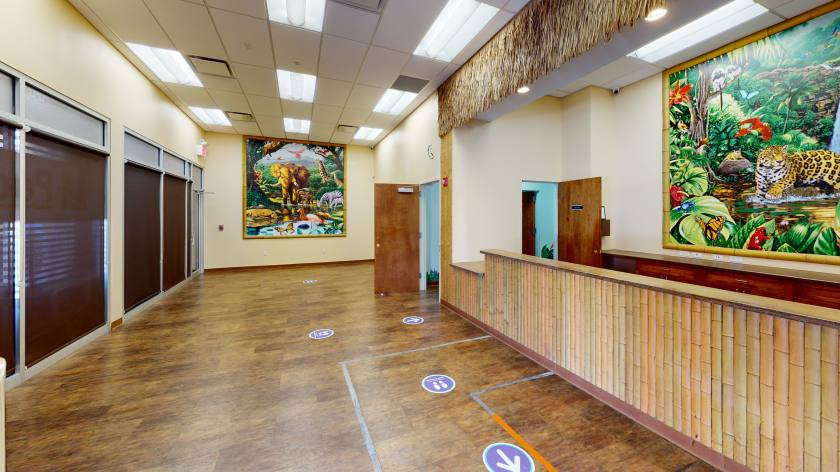
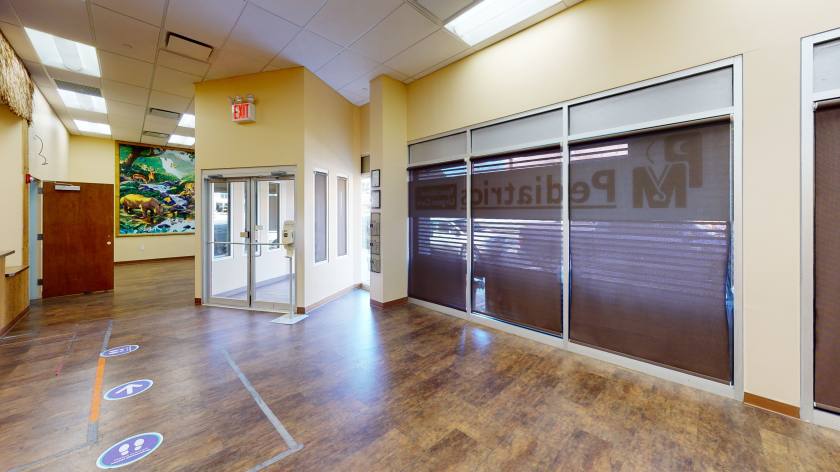
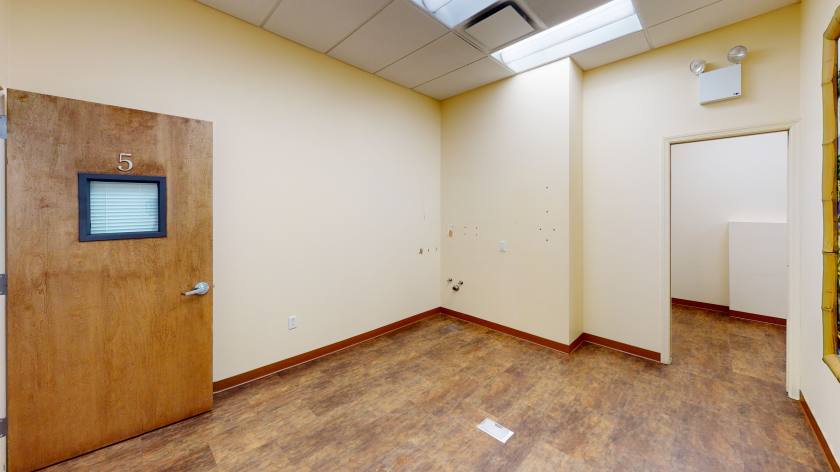
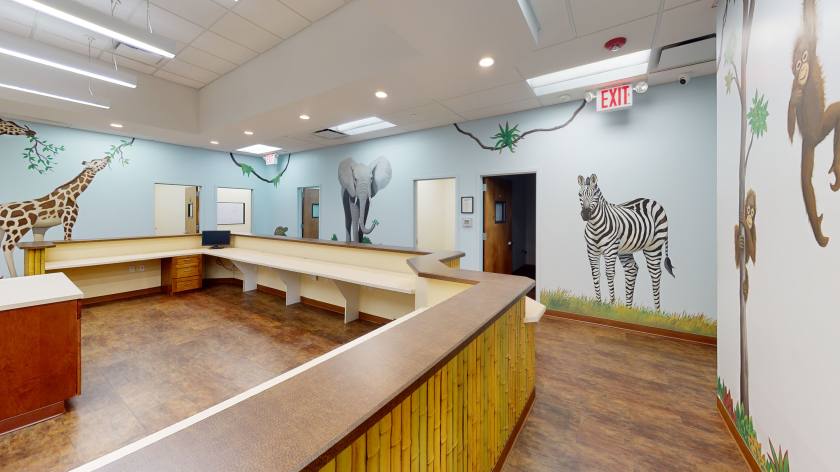
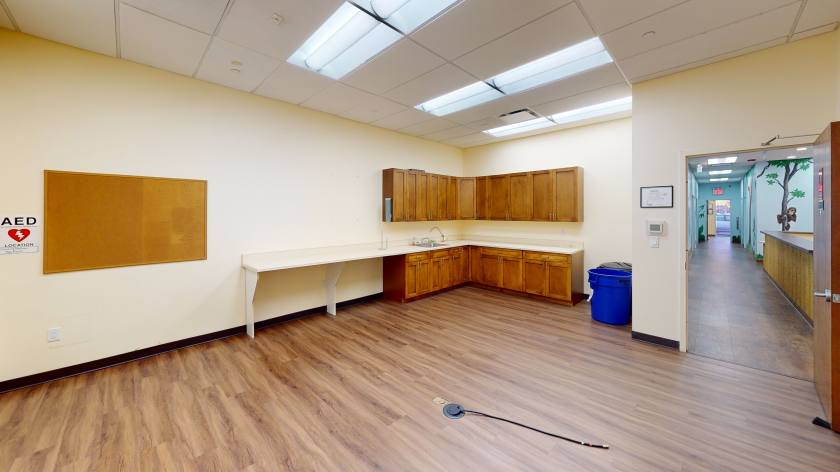
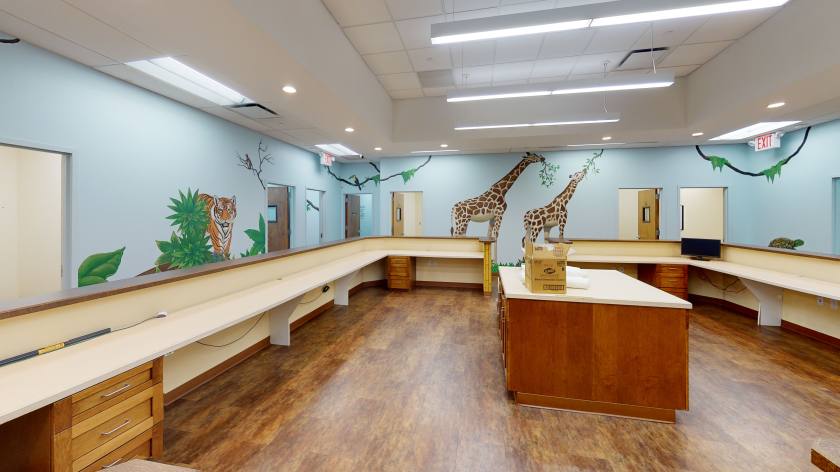
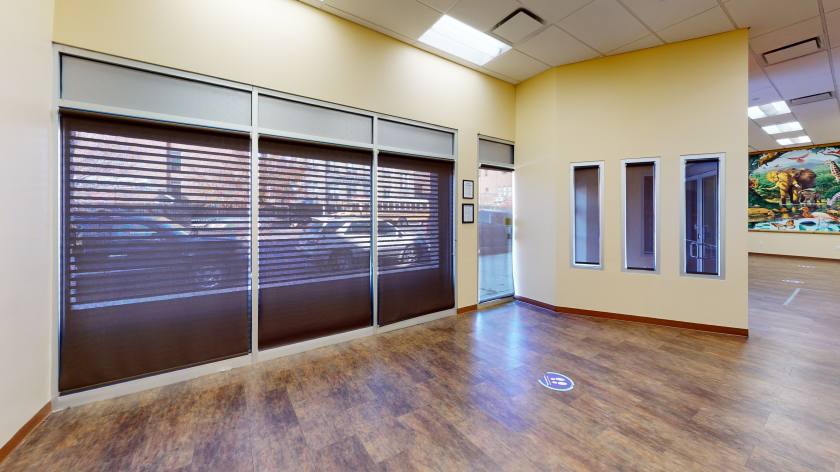
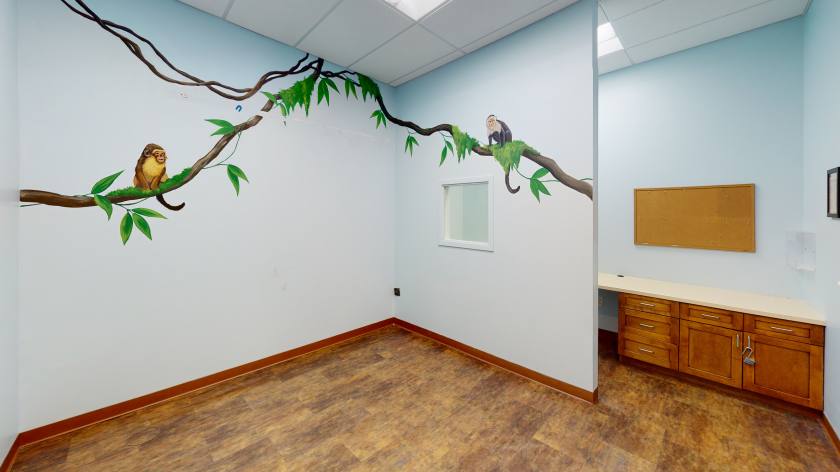
Property Highlights
- • Fully built for medical
- • 60 Foot Frontage
- • Divisible in half
- • Move-in ready
- • Newly renovated
Additional Photos


Listing Agents

Shlomi Bagdadi
O: 718-437-6100
info@tristatecr.com
O: 718-437-6100
info@tristatecr.com
While we strive to provide the most accurate information, all listing information, and demographic data, is provided by third-parties. As such, MyEListing will not be responsible for the accuracy of the information. It is strongly recommended that you verify all information with the listing agent, and any relevant agencies, prior to making any decisions.