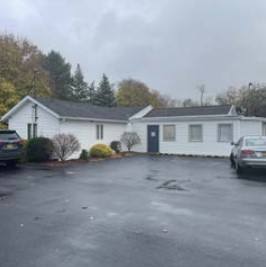
Office Space
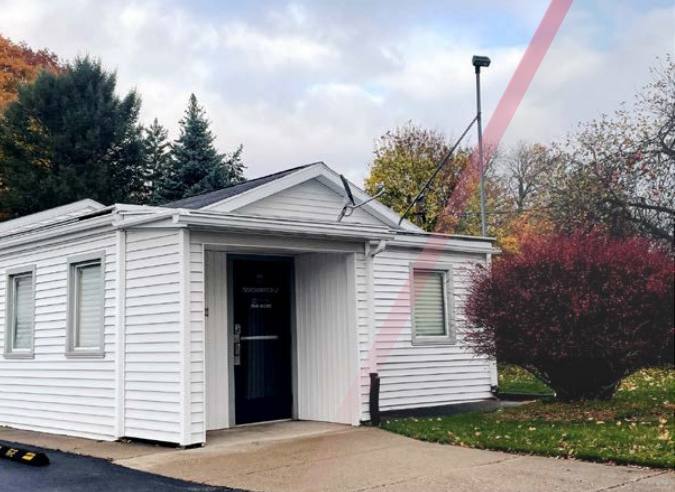
106 Munson Street Le Roy, NY 14482
106 Munson Street Le Roy, NY 14482
Details & Description
Property Highlights
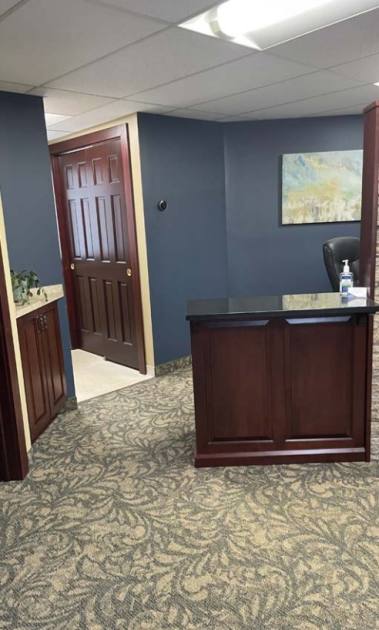
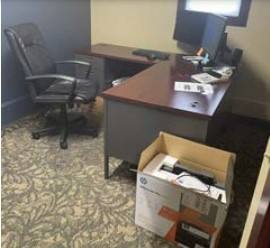
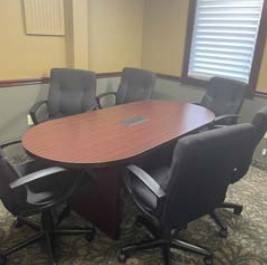
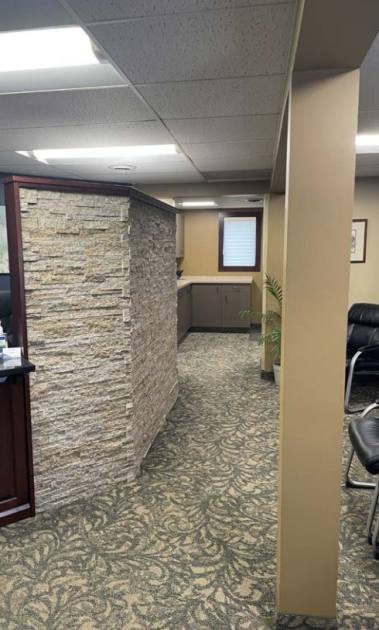
• 2 offices, conference room, kitchenette, bathroom, storage and reception area
• Located in a park-like setting next to Leroy swim, tennis and baseball fields
Additional Photos
Listing Agents

Jonathan Maurer
O: 585-248-9426
M: 585-899-9771
jmaurer@pyramidbrokerage.com
O: 585-248-9426
M: 585-899-9771
jmaurer@pyramidbrokerage.com
While we strive to provide the most accurate information, all listing information, and demographic data, is provided by third-parties. As such, MyEListing will not be responsible for the accuracy of the information. It is strongly recommended that you verify all information with the listing agent, and any relevant agencies, prior to making any decisions.