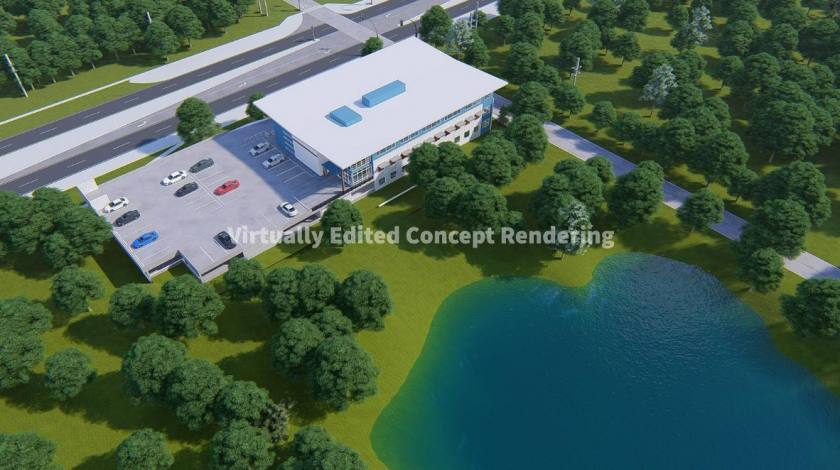
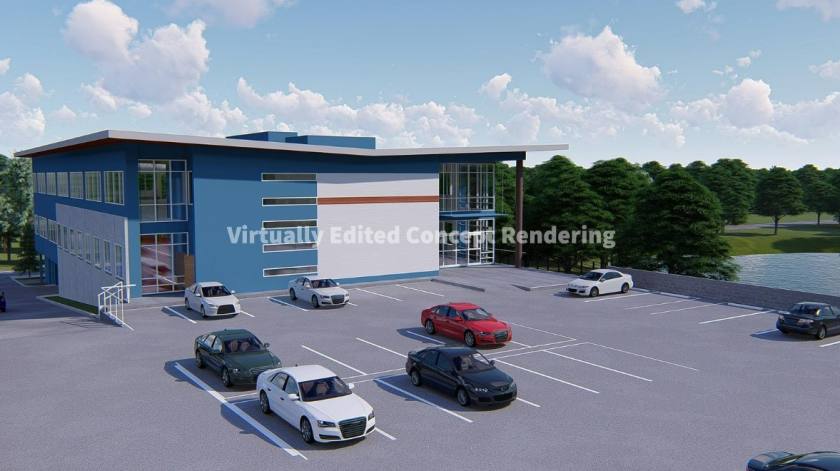
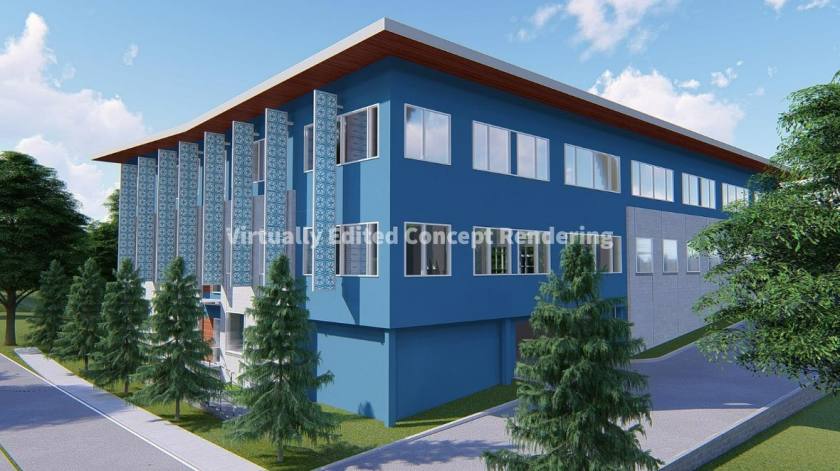
Located in growing Hernando County area of Weeki Wachee.
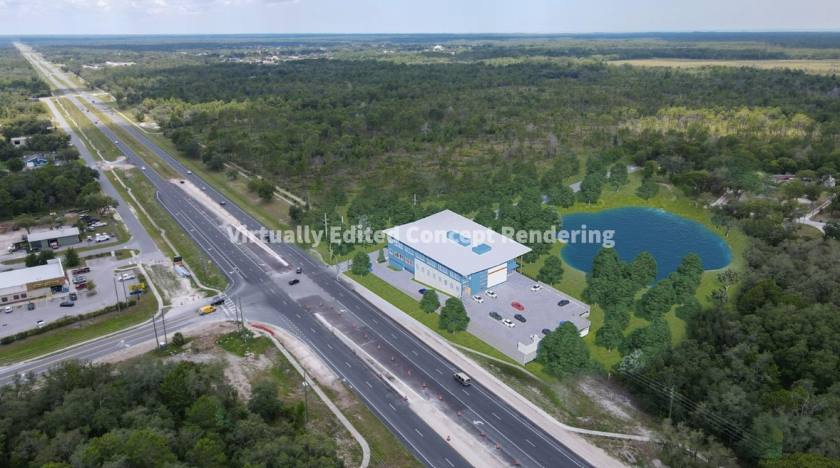
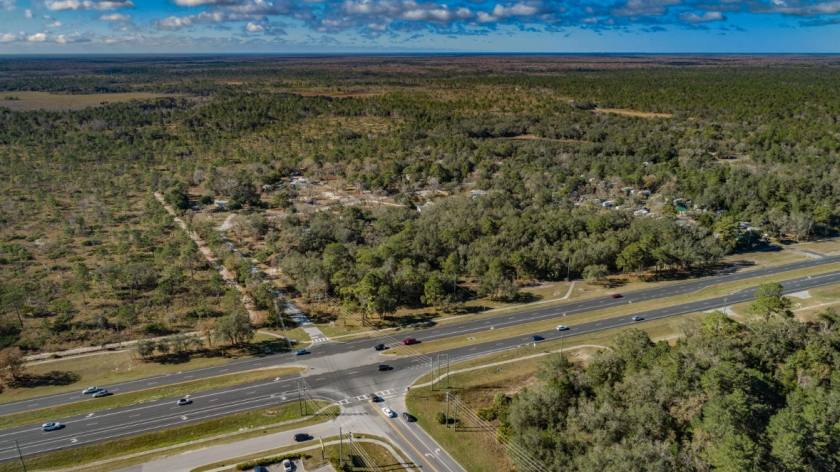
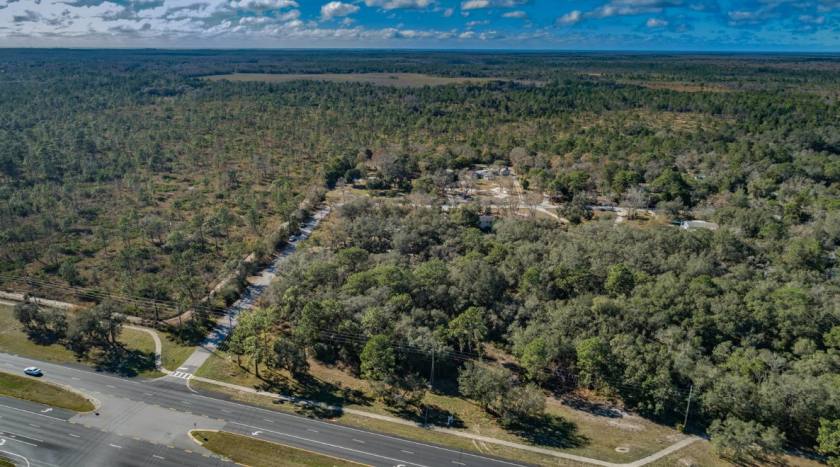
Come see this piece of prime property ready for your choice of development on US Highway 19 at the corners of Chicago Avenue and Hexam Road.
Four (4) Parcels on Commercial Way, Weeki Wachee, Florida34614 with the parcel numbers R12-222-17-3720-00F0-0110 /
R12-222-17-3720-00F0-0120 / R12-222-17-3720-00F00100 / R12-222-17-3720-00F00090 Total of 2.0644 Acres / 89,925 Sq. Ft. / Asking price $925,500.00 Total available of 3.3493 Acres / 145,895 Sq. Ft. (5 total parcels). Commercial Zoning conversion in process.
Ask Broker about the recent 42+% reduction in price per acre on 4 of the 5 parcels.
Minutes from the Suncoast Parkway, Commercial businesses, shopping, restaurants, schools and parks.
Minutes from Annutteliga Hammock Hiking and Walking Trails.
Minutes from Hernando Beach and Gulf of Mexico.
Minutes from Weeki Wachee Springs State Park where they have kayaking, boat tours and Mermaid shows.
No part of this information may be copied, reproduced, repurposed, or screen-captured for any commercial purpose without prior written authorization from MyEListing.
While we strive to provide the most accurate information, all listing information, and demographic data, is provided by third-parties. As such, MyEListing will not be responsible for the accuracy of the information. It is strongly recommended that you verify all information with the listing agent, and any relevant agencies, prior to making any decisions.
What is the asking price for 11105 Commercial Way in Brooksville?
The asking price for 11105 Commercial Way is $925,500
How much land does the Brooksville, FL property at 11105 Commercial Way include?
11105 Commercial Way in Brooksville includes 2.060 acres of land
What kind of Land is the propery at 11105 Commercial Way?
The property at 11105 Commercial Way Brooksville, FL 34614 is listed as a Mixed Use Land Land property
What is the population within 1 mile of 11105 Commercial Way in Brooksville?
The population within 1 mile of 11105 Commercial Way Brooksville, FL 34614 is 701 people.
Who do I contact for questions about 11105 Commercial Way?
You should contact the listing agent,
Coach Cook, for any details regarding this commercial listing.