Industrial Properties
10770 North 46th Street Tampa, FL 33617
10770 North 46th Street Tampa, FL 33617
Details & Description
Property Highlights
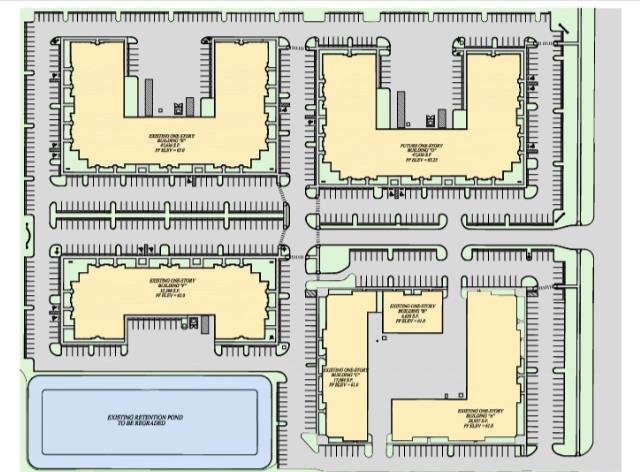
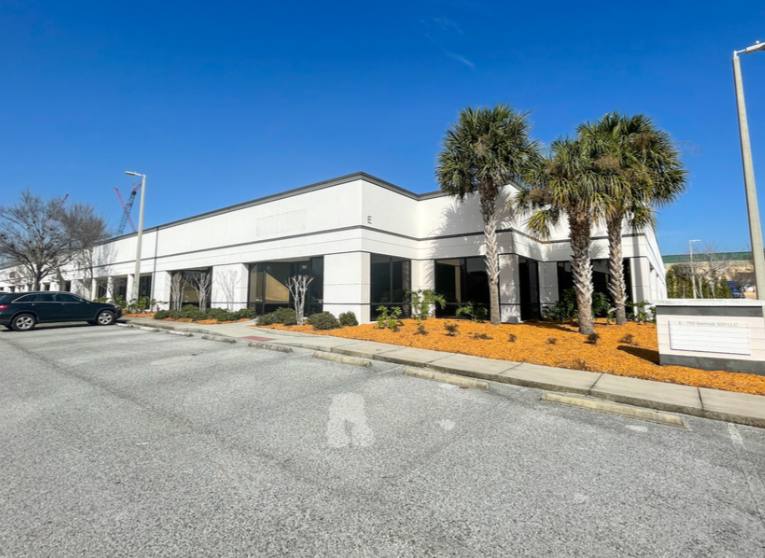
- • Ample parking
- • Build to suit opportunity
- • Both Office and Flex spaces available
- • Verizon Smartpark
- • Year Built 2006
Listing Agents

Kenny Anderson
O: 813-875-0100
M: 813-335-6362
kenny.anderson@svn.com
O: 813-875-0100
M: 813-335-6362
kenny.anderson@svn.com

John Milsaps
O: 813-563-8666
john.milsaps@svn.com
O: 813-563-8666
john.milsaps@svn.com
While we strive to provide the most accurate information, all listing information, and demographic data, is provided by third-parties. As such, MyEListing will not be responsible for the accuracy of the information. It is strongly recommended that you verify all information with the listing agent, and any relevant agencies, prior to making any decisions.