Flex-Office-Warehouse
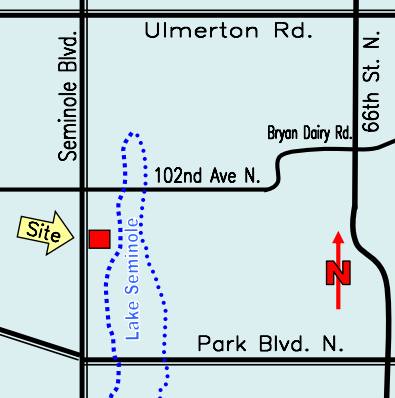
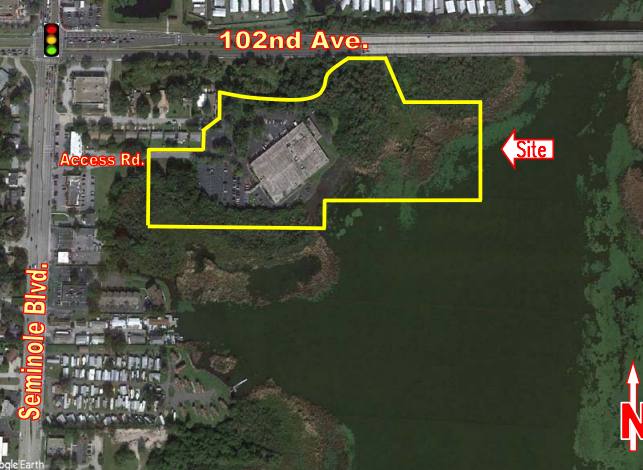
10055 Seminole Boulevard Seminole, FL 33772
10055 Seminole Boulevard Seminole, FL 33772
Details & Description
Property Highlights
- • MID COUNTY LOCATION
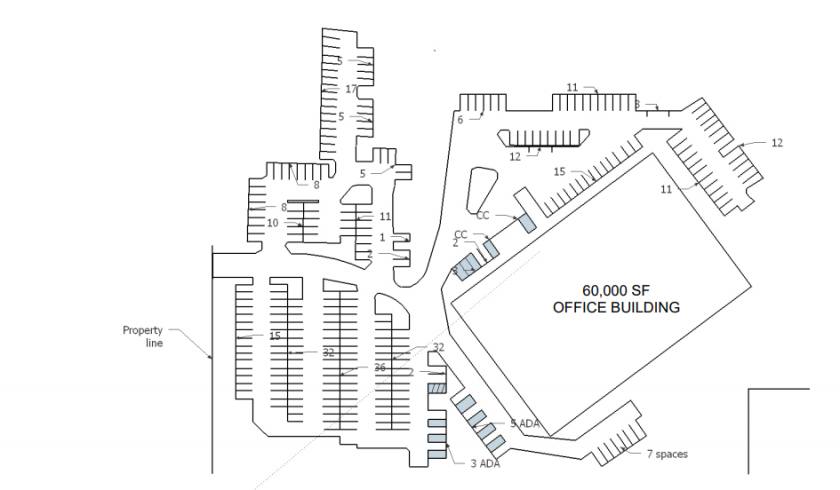
- • 60,000 SF FLEX BUILDING
- • 281 PARKING SPACES
- • FULL BUILDING EMERGENCY GENERATOR
- • DIRECT ACCESS TO I?275
- • 100% HVAC
Listing Agents

Mark Klein
O: 727-441-1951
mark.klein3@gmail.com
O: 727-441-1951
mark.klein3@gmail.com

Steven Klein
O: 727-441-1951
stevenklein@kleinandheuchan.com
O: 727-441-1951
stevenklein@kleinandheuchan.com
While we strive to provide the most accurate information, all listing information, and demographic data, is provided by third-parties. As such, MyEListing will not be responsible for the accuracy of the information. It is strongly recommended that you verify all information with the listing agent, and any relevant agencies, prior to making any decisions.