Commercial Land
Harring Way Placida, FL 33946
Harring Way Placida, FL 33946
Details & Description
Property Highlights
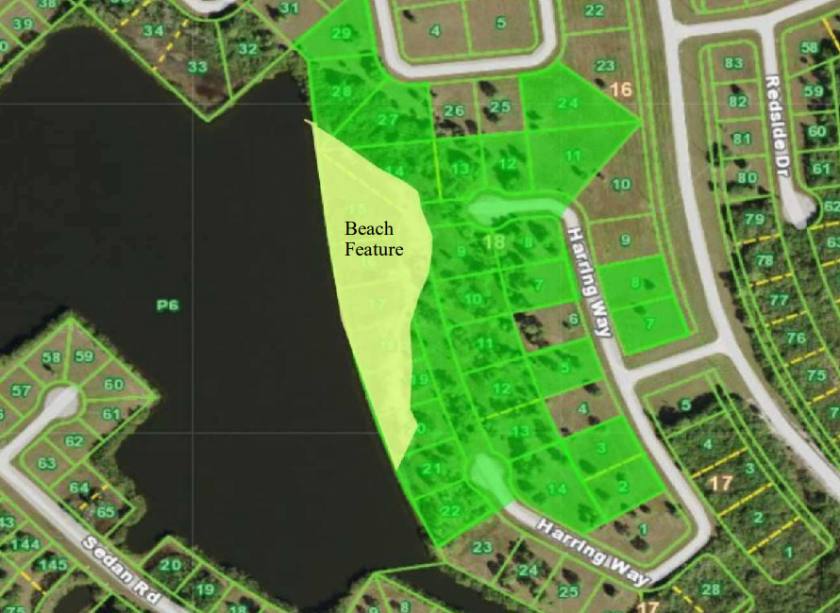
• ACCESS: Easy access off of Hwy 771 in the Rotonda Area. All roads are public, paved roads.
• ZONING: All lots are zoned residential and allow up to 33 units total.
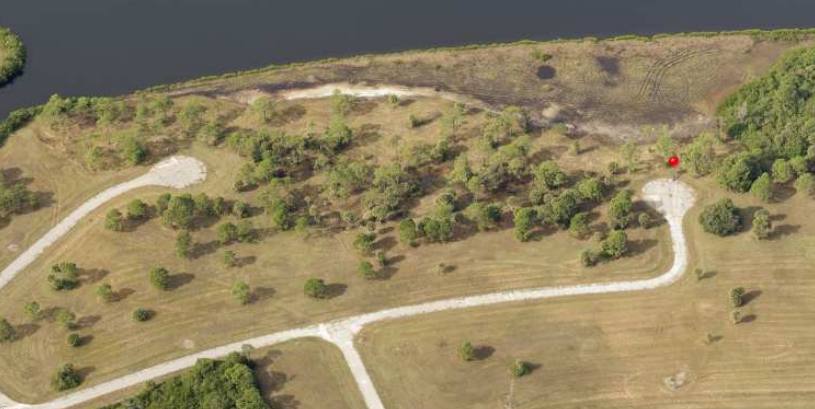
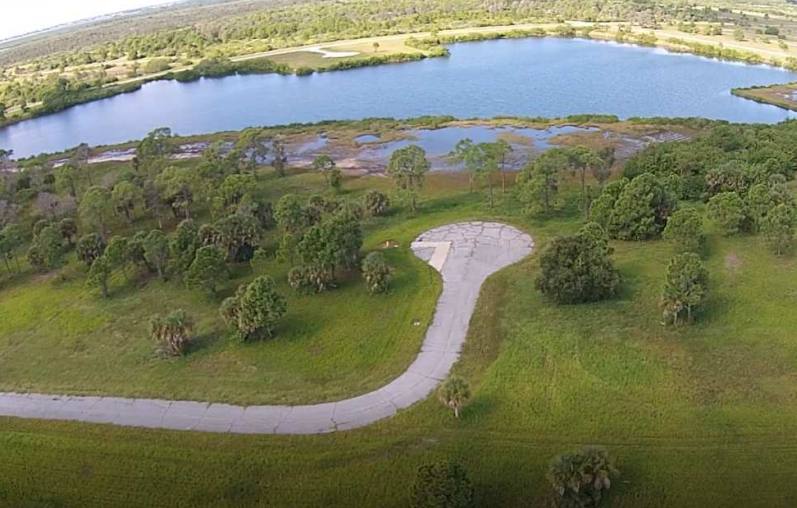
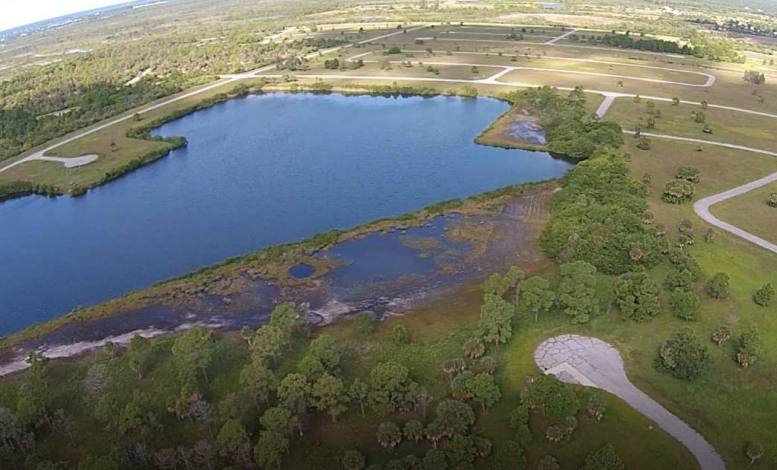
Additional Photos
Listing Agents

Sage Andress
O: 813-416-4254
M: 813-416-4254
sage.sunmark@outlook.com
O: 813-416-4254
M: 813-416-4254
sage.sunmark@outlook.com
While we strive to provide the most accurate information, all listing information, and demographic data, is provided by third-parties. As such, MyEListing will not be responsible for the accuracy of the information. It is strongly recommended that you verify all information with the listing agent, and any relevant agencies, prior to making any decisions.


