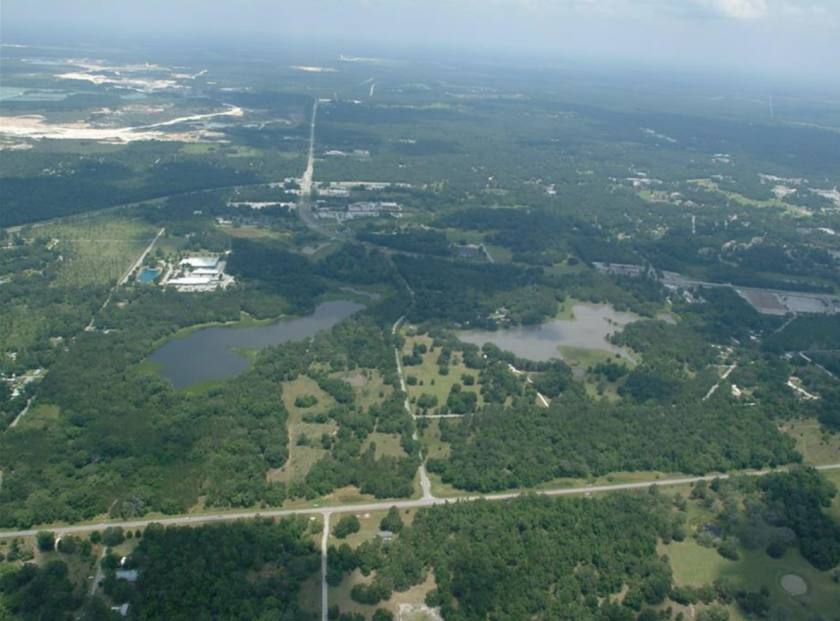
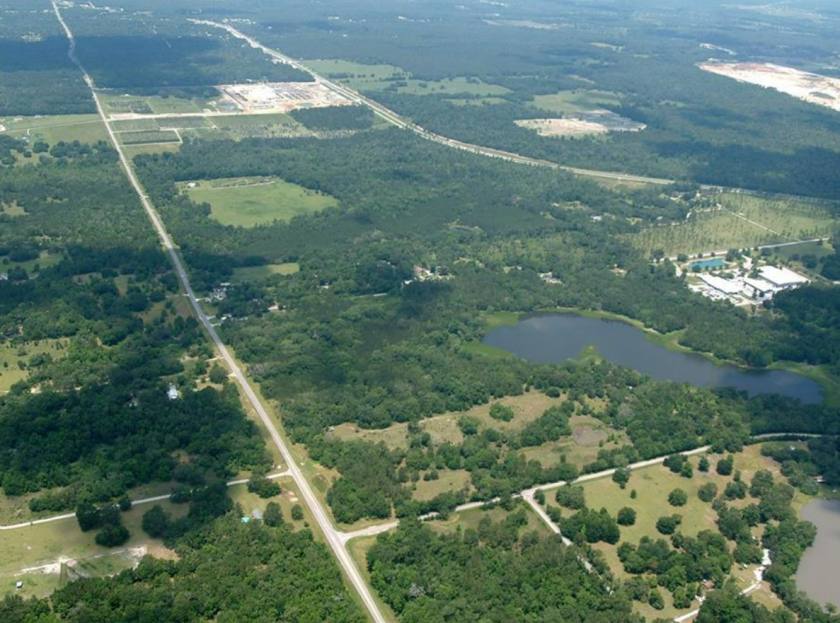
1-Mile | 3-Miles | 5-Miles | ||
---|---|---|---|---|
Total Population | 1,255 | 10,578 | 30,722 | |
Population Median Age | 50 | 44 | 48 | |
Population by Age | 0-9 Yrs | 40 (3%) | 874 (8%) | 2340 (7%) |
10-19 Yrs | 162 (12%) | 1308 (12%) | 2951 (9%) | |
20-29 Yrs | 111 (8%) | 1338 (12%) | 3111 (10%) | |
30-39 Yrs | 140 (11%) | 1167 (11%) | 3254 (10%) | |
40-49 Yrs | 37 (2%) | 791 (7%) | 2720 (8%) | |
50-59 Yrs | 266 (21%) | 1796 (16%) | 4637 (15%) | |
60-69 Yrs | 202 (16%) | 1422 (13%) | 4690 (15%) | |
70+ Yrs | 297 (23%) | 1881 (17%) | 7019 (22%) | |
Median HH Income | $41,688 | $38,282 | $45,194 | |
Total Household Income | < 24K | 182 (30%) | 1531 (33%) | 3478 (26%) |
25-49K | 250 (42%) | 1539 (33%) | 3827 (29%) | |
50-74K | 56 (9%) | 603 (13%) | 2091 (16%) | |
75-99K | 58 (9%) | 489 (10%) | 1555 (11%) | |
100-199K | 35 (5%) | 381 (8%) | 1667 (12%) | |
200K+ | 8 (1%) | 88 (1%) | 386 (2%) | |
Highest Education Level | No Diploma | 103 | 966 | 2870 |
Diploma or GED | 409 | 2844 | 8421 | |
Some College | 239 | 1678 | 5380 | |
Assoc. Degree | 73 | 676 | 2415 | |
Bachelors Degree | 103 | 998 | 3083 | |
Higher Degree | 57 | 452 | 1575 | |
Total Housing Units | 710 | 5,449 | 15,280 | |
--Owner-Occupied | 284 | 2,628 | 9,583 | |
--Renter-Occupied | 306 | 2,002 | 3,422 | |
Owner-Occupied Values | < 100K | 142 | 1381 | 4552 |
100-199K | 46 | 529 | 2499 | |
200-299K | 77 | 507 | 1504 | |
300-399K | 10 | 102 | 515 | |
400-499K | 5 | 54 | 244 | |
500K+ | 3 | 56 | 269 | |
Total Working Age Population | 1,074 | 8,851 | 26,518 | |
In Work Force | 523 | 4,354 | 11,304 | |
Not In Work Force | 552 | 4,497 | 15,214 | |
Workforce Employed | 509 | 4,188 | 10,760 | |
Workforce Unemployed | 14 | 166 | 544 | |
Civlian Workforce | 523 | 4,354 | 11,304 | |
Military Workforce | 0 | 0 | 0 | |
Total Households | 590 | 4,630 | 13,006 | |
Family Households | 288 | 2,613 | 8,037 | |
Non-Family Households | 302 | 2,018 | 4,969 | |
Married Couple | 164 | 1,582 | 5,875 | |
Other Family | 123 | 1,031 | 2,161 | |
Married w/Child | 14 | 337 | 1,114 | |
Single Male w/Child | 0 | 77 | 193 | |
Single Female w/Child | 90 | 670 | 1,018 |
Population Change Last Two Decades - Plus Projection
2000 | % | 2010 | % | 2020 | % | 2030 | |
---|---|---|---|---|---|---|---|
Florida | 15,982,378 | +18 | 18,801,310 | +14 | 21,517,610 | +13 | 24,340,457 |
Hernando County | 130,802 | +32 | 172,778 | +11 | 191,741 | +14 | 218,337 |
Total Working Age Population:
Total Households:
Total Working Age Population:
Total Households:
Total Working Age Population:
Total Households: