Retail Space
4903 Walzem Road Windcrest, TX 78218
4903 Walzem Road Windcrest, TX 78218
Details & Description
Property Highlights
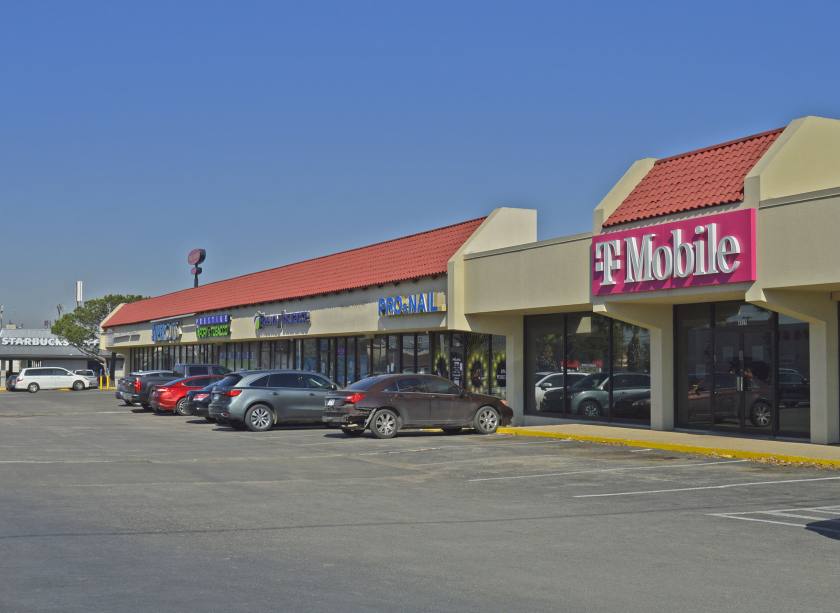
- • The center immediately borders a Starbucks
- • Excellent visibility from Walzem Road
- • Tenants include T-Mobile and Supercuts
Additional Photos


Listing Agents

Brittney Dale
O: 210-222-2424
M: 210-587-9078
brittney.dale@dhrp.us
O: 210-222-2424
M: 210-587-9078
brittney.dale@dhrp.us
While we strive to provide the most accurate information, all listing information, and demographic data, is provided by third-parties. As such, MyEListing will not be responsible for the accuracy of the information. It is strongly recommended that you verify all information with the listing agent, and any relevant agencies, prior to making any decisions.


