Office Space
4913 West Laurel Street Tampa, FL 33607
4913 West Laurel Street Tampa, FL 33607
Details & Description
Property Highlights
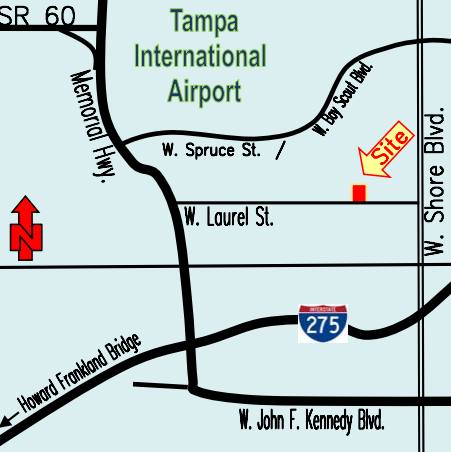
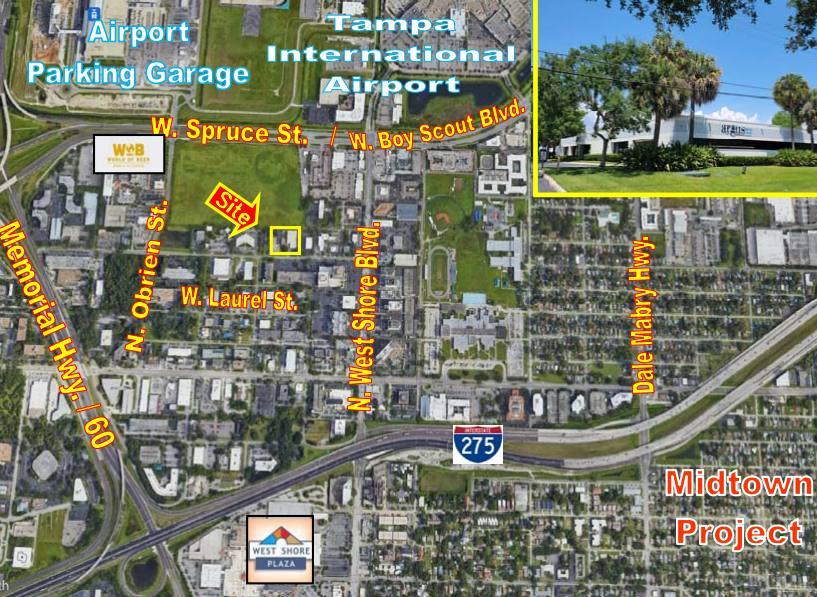
• LOCATION: Property is located south of Spruce/ Boy Scout Blvd. in between O’Brien St & Westshore Blvd
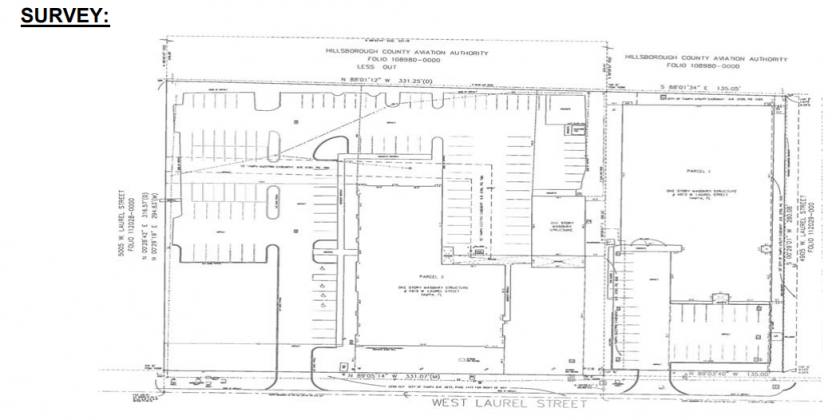
• LAND AREA: 134,168 SF (3.08 ac)
Listing Agents

Larry Gilbert
O: 727-441-1951
lgilbert001@gmail.com
O: 727-441-1951
lgilbert001@gmail.com
While we strive to provide the most accurate information, all listing information, and demographic data, is provided by third-parties. As such, MyEListing will not be responsible for the accuracy of the information. It is strongly recommended that you verify all information with the listing agent, and any relevant agencies, prior to making any decisions.