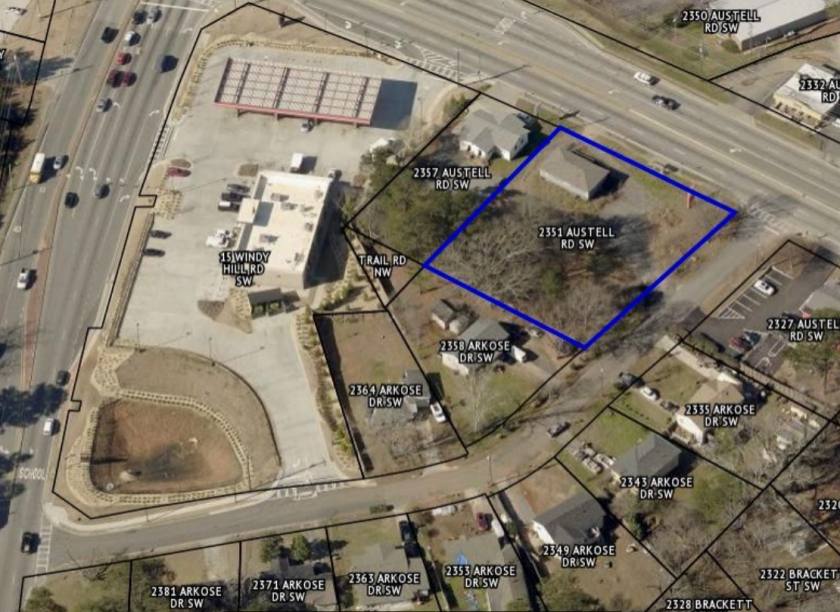
1-Mile | 3-Miles | 5-Miles | ||
---|---|---|---|---|
Total Population | 12,758 | 90,740 | 198,572 | |
Population Median Age | 33 | 36 | 36 | |
Population by Age | 0-9 Yrs | 1716 (13%) | 12671 (13%) | 27158 (13%) |
10-19 Yrs | 1886 (14%) | 13426 (14%) | 26460 (13%) | |
20-29 Yrs | 2315 (18%) | 12566 (13%) | 28695 (14%) | |
30-39 Yrs | 2343 (18%) | 14312 (15%) | 31422 (15%) | |
40-49 Yrs | 1675 (13%) | 12586 (13%) | 27591 (13%) | |
50-59 Yrs | 1262 (9%) | 10105 (11%) | 23495 (11%) | |
60-69 Yrs | 1052 (8%) | 8922 (9%) | 18919 (9%) | |
70+ Yrs | 511 (4%) | 6155 (6%) | 14831 (7%) | |
Median HH Income | $48,171 | $62,294 | $68,323 | |
Total Household Income | < 24K | 926 (25%) | 5250 (16%) | 11025 (15%) |
25-49K | 933 (26%) | 7348 (23%) | 14962 (20%) | |
50-74K | 664 (18%) | 6169 (19%) | 13953 (19%) | |
75-99K | 494 (13%) | 4049 (12%) | 9799 (13%) | |
100-199K | 506 (14%) | 7142 (22%) | 17626 (24%) | |
200K+ | 58 (1%) | 1541 (4%) | 5504 (7%) | |
Highest Education Level | No Diploma | 1910 | 10802 | 16503 |
Diploma or GED | 2573 | 14580 | 28815 | |
Some College | 1875 | 12128 | 26320 | |
Assoc. Degree | 594 | 4588 | 9628 | |
Bachelors Degree | 797 | 11152 | 32758 | |
Higher Degree | 383 | 5563 | 17793 | |
Total Housing Units | 3,882 | 33,906 | 78,569 | |
--Owner-Occupied | 1,574 | 18,263 | 43,209 | |
--Renter-Occupied | 2,007 | 13,235 | 29,659 | |
Owner-Occupied Values | < 100K | 224 | 1879 | 3463 |
100-199K | 777 | 6927 | 13767 | |
200-299K | 500 | 5957 | 12288 | |
300-399K | 27 | 2214 | 7392 | |
400-499K | 18 | 648 | 2879 | |
500K+ | 28 | 639 | 3421 | |
Total Working Age Population | 9,940 | 69,306 | 155,006 | |
In Work Force | 5,271 | 45,686 | 105,799 | |
Not In Work Force | 4,669 | 23,620 | 49,208 | |
Workforce Employed | 4,952 | 43,575 | 101,189 | |
Workforce Unemployed | 319 | 2,054 | 4,443 | |
Civlian Workforce | 5,271 | 45,629 | 105,632 | |
Military Workforce | 0 | 57 | 167 | |
Total Households | 3,581 | 31,499 | 72,868 | |
Family Households | 2,320 | 20,929 | 47,245 | |
Non-Family Households | 1,261 | 10,569 | 25,623 | |
Married Couple | 1,257 | 12,494 | 30,805 | |
Other Family | 1,063 | 8,435 | 16,440 | |
Married w/Child | 541 | 5,389 | 13,380 | |
Single Male w/Child | 85 | 1,357 | 2,052 | |
Single Female w/Child | 449 | 3,373 | 6,475 |
Population Change Last Two Decades - Plus Projection
2000 | % | 2010 | % | 2020 | % | 2030 | |
---|---|---|---|---|---|---|---|
Georgia | 8,186,453 | +18 | 9,687,653 | +12 | 10,833,472 | +13 | 12,292,423 |
Cobb County | 607,751 | +13 | 688,078 | +15 | 790,588 | +19 | 938,747 |
Total Working Age Population:
Total Households:
Total Working Age Population:
Total Households:
Total Working Age Population:
Total Households: