Health Care and Medical Properties
1578 Sherman Avenue Cincinnati, OH 45212
1578 Sherman Avenue Cincinnati, OH 45212

Details & Description
Property Highlights
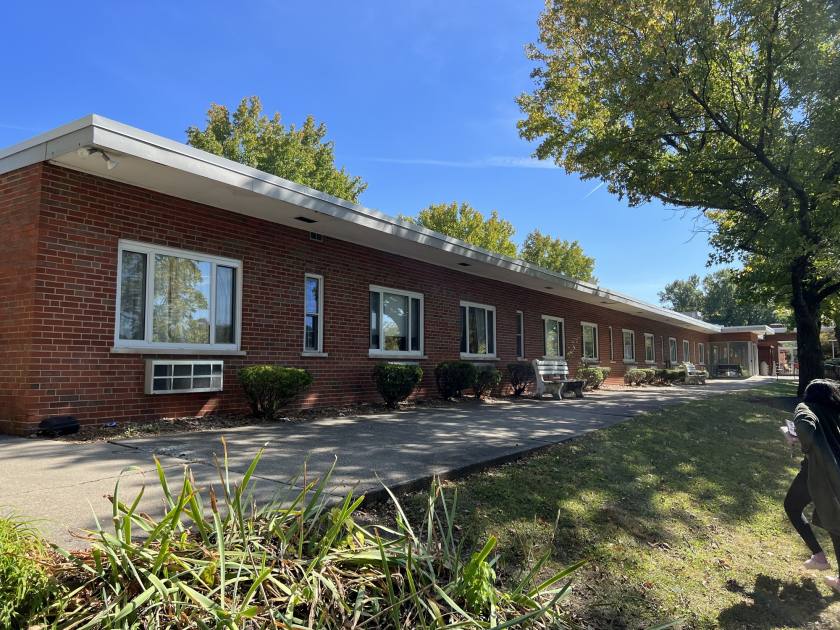
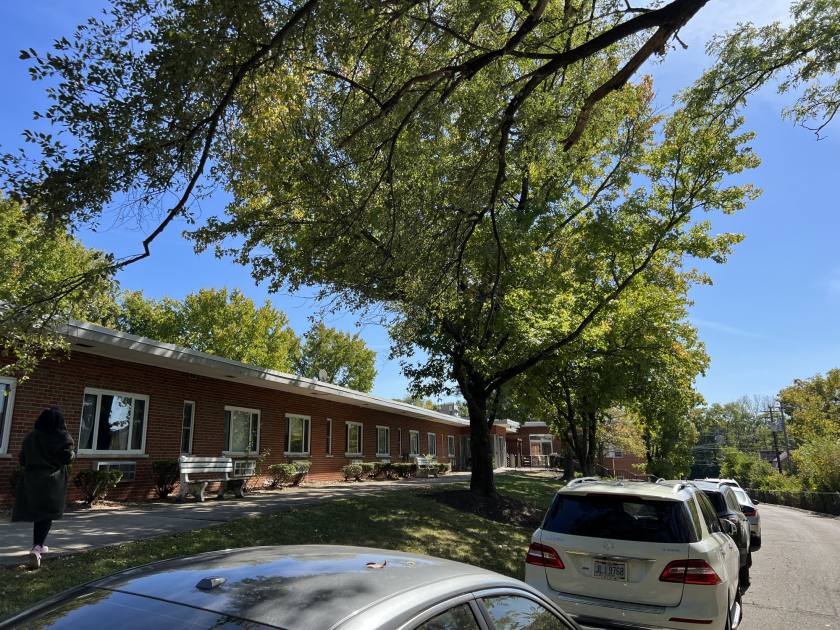
- • 34,472 SF Two Story Former Nursing Facility
- • Currently set up for 55 Units
- • Strong Signage
- • Quick Commute to Xavier University
- • 303,555 population within 5 mile radius
Additional Photos


Listing Agents

Michael Bergman
O: 513-322-6309
M: 678-595-5954
mbergman@bergmancommercial.com
O: 513-322-6309
M: 678-595-5954
mbergman@bergmancommercial.com
While we strive to provide the most accurate information, all listing information, and demographic data, is provided by third-parties. As such, MyEListing will not be responsible for the accuracy of the information. It is strongly recommended that you verify all information with the listing agent, and any relevant agencies, prior to making any decisions.