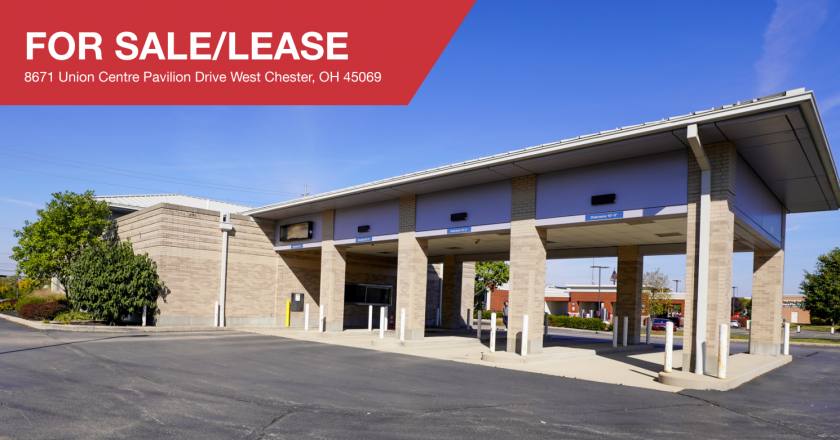
1-Mile | 3-Miles | 5-Miles | ||
---|---|---|---|---|
Total Population | 3,363 | 46,959 | 152,084 | |
Population Median Age | 35 | 37 | 38 | |
Population by Age | 0-9 Yrs | 651 (19%) | 6820 (14%) | 20508 (13%) |
10-19 Yrs | 383 (11%) | 6126 (13%) | 20207 (13%) | |
20-29 Yrs | 405 (12%) | 6384 (13%) | 19706 (12%) | |
30-39 Yrs | 431 (12%) | 6450 (13%) | 19839 (13%) | |
40-49 Yrs | 659 (19%) | 6370 (13%) | 19916 (13%) | |
50-59 Yrs | 270 (8%) | 5659 (12%) | 19625 (12%) | |
60-69 Yrs | 253 (7%) | 5709 (12%) | 18318 (12%) | |
70+ Yrs | 312 (9%) | 3440 (7%) | 13965 (9%) | |
Median HH Income | $88,530 | $73,340 | $72,952 | |
Total Household Income | < 24K | 132 (10%) | 2627 (14%) | 7839 (13%) |
25-49K | 233 (18%) | 3544 (19%) | 11193 (19%) | |
50-74K | 151 (11%) | 3140 (17%) | 10736 (18%) | |
75-99K | 240 (18%) | 2280 (12%) | 7955 (13%) | |
100-199K | 423 (32%) | 4790 (26%) | 15485 (26%) | |
200K+ | 113 (8%) | 1837 (10%) | 4526 (7%) | |
Highest Education Level | No Diploma | 143 | 2070 | 7190 |
Diploma or GED | 589 | 8167 | 28809 | |
Some College | 355 | 5332 | 20079 | |
Assoc. Degree | 134 | 2310 | 8098 | |
Bachelors Degree | 508 | 8561 | 24346 | |
Higher Degree | 446 | 4660 | 13071 | |
Total Housing Units | 1,340 | 19,067 | 60,800 | |
--Owner-Occupied | 795 | 11,412 | 38,618 | |
--Renter-Occupied | 496 | 6,807 | 19,116 | |
Owner-Occupied Values | < 100K | 118 | 1705 | 5956 |
100-199K | 251 | 4042 | 15303 | |
200-299K | 386 | 3168 | 11069 | |
300-399K | 40 | 1344 | 4023 | |
400-499K | 0 | 687 | 1142 | |
500K+ | 0 | 466 | 1125 | |
Total Working Age Population | 2,403 | 36,266 | 118,925 | |
In Work Force | 1,693 | 25,748 | 81,808 | |
Not In Work Force | 711 | 10,518 | 37,116 | |
Workforce Employed | 1,551 | 24,268 | 77,808 | |
Workforce Unemployed | 141 | 1,431 | 3,925 | |
Civlian Workforce | 1,693 | 25,700 | 81,732 | |
Military Workforce | 0 | 49 | 76 | |
Total Households | 1,291 | 18,218 | 57,735 | |
Family Households | 888 | 12,022 | 39,509 | |
Non-Family Households | 403 | 6,196 | 18,225 | |
Married Couple | 721 | 8,761 | 29,364 | |
Other Family | 167 | 3,261 | 10,145 | |
Married w/Child | 429 | 4,071 | 12,293 | |
Single Male w/Child | 38 | 412 | 1,298 | |
Single Female w/Child | 51 | 1,536 | 4,506 |
Population Change Last Two Decades - Plus Projection
2000 | % | 2010 | % | 2020 | % | 2030 | |
---|---|---|---|---|---|---|---|
Ohio | 11,353,140 | +2 | 11,536,504 | 0 | 11,574,870 | 0 | 11,615,100 |
Hamilton County | 845,303 | -5 | 802,374 | -1 | 790,600 | -1 | 785,900 |
Butler County | 332,807 | +11 | 368,130 | +6 | 390,110 | +5 | 410,960 |
Total Working Age Population:
Total Households:
Total Working Age Population:
Total Households:
Total Working Age Population:
Total Households: