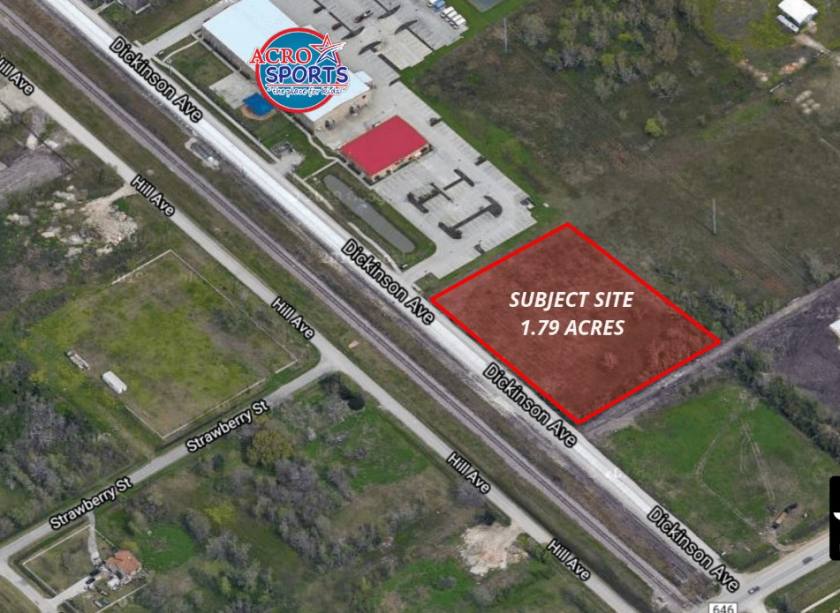
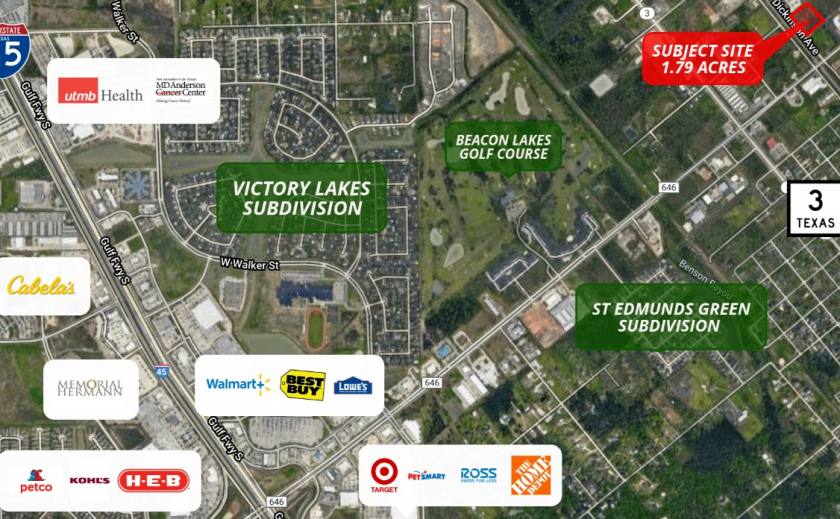
1-Mile | 3-Miles | 5-Miles | ||
---|---|---|---|---|
Total Population | 5,405 | 68,982 | 148,098 | |
Population Median Age | 34 | 35 | 36 | |
Population by Age | 0-9 Yrs | 1012 (18%) | 11235 (16%) | 21631 (14%) |
10-19 Yrs | 529 (9%) | 10279 (14%) | 21922 (14%) | |
20-29 Yrs | 1173 (21%) | 8964 (12%) | 19258 (13%) | |
30-39 Yrs | 652 (12%) | 9820 (14%) | 21598 (14%) | |
40-49 Yrs | 637 (11%) | 9904 (14%) | 21576 (14%) | |
50-59 Yrs | 458 (8%) | 7511 (10%) | 17885 (12%) | |
60-69 Yrs | 564 (10%) | 6028 (8%) | 13943 (9%) | |
70+ Yrs | 380 (7%) | 5241 (7%) | 10285 (6%) | |
Median HH Income | $84,076 | $91,124 | $89,906 | |
Total Household Income | < 24K | 265 (13%) | 3313 (14%) | 6386 (11%) |
25-49K | 252 (13%) | 2541 (10%) | 8118 (15%) | |
50-74K | 337 (17%) | 3810 (16%) | 8604 (15%) | |
75-99K | 293 (15%) | 3359 (14%) | 6482 (12%) | |
100-199K | 554 (28%) | 7762 (32%) | 17596 (32%) | |
200K+ | 220 (11%) | 2876 (12%) | 6760 (12%) | |
Highest Education Level | No Diploma | 260 | 3820 | 7237 |
Diploma or GED | 924 | 9490 | 19183 | |
Some College | 757 | 9426 | 20759 | |
Assoc. Degree | 262 | 4931 | 10266 | |
Bachelors Degree | 898 | 11219 | 25588 | |
Higher Degree | 309 | 5220 | 13226 | |
Total Housing Units | 2,126 | 25,352 | 57,942 | |
--Owner-Occupied | 1,006 | 16,996 | 36,456 | |
--Renter-Occupied | 915 | 6,664 | 17,490 | |
Owner-Occupied Values | < 100K | 236 | 2710 | 3924 |
100-199K | 146 | 5120 | 9861 | |
200-299K | 329 | 5281 | 12834 | |
300-399K | 191 | 2506 | 5959 | |
400-499K | 86 | 894 | 2090 | |
500K+ | 19 | 485 | 1789 | |
Total Working Age Population | 4,181 | 51,673 | 112,977 | |
In Work Force | 2,868 | 34,437 | 77,849 | |
Not In Work Force | 1,313 | 17,236 | 35,128 | |
Workforce Employed | 2,765 | 33,223 | 74,491 | |
Workforce Unemployed | 92 | 1,155 | 3,133 | |
Civlian Workforce | 2,857 | 34,378 | 77,625 | |
Military Workforce | 11 | 59 | 224 | |
Total Households | 1,922 | 23,660 | 53,945 | |
Family Households | 1,295 | 17,849 | 38,162 | |
Non-Family Households | 627 | 5,811 | 15,784 | |
Married Couple | 868 | 13,818 | 30,005 | |
Other Family | 427 | 4,031 | 8,157 | |
Married w/Child | 484 | 7,399 | 14,566 | |
Single Male w/Child | 41 | 827 | 1,338 | |
Single Female w/Child | 88 | 1,378 | 3,160 |
Population Change Last Two Decades - Plus Projection
2000 | % | 2010 | % | 2020 | % | 2030 | |
---|---|---|---|---|---|---|---|
Texas | 20,851,820 | +21 | 25,145,561 | +18 | 29,677,668 | +18 | 34,894,452 |
Galveston County | 250,158 | +16 | 291,309 | +22 | 355,196 | +20 | 427,028 |
Harris County | 3,400,578 | +20 | 4,092,459 | +22 | 4,978,845 | +19 | 5,924,750 |
Chambers County | 26,031 | +35 | 35,096 | +21 | 42,320 | +24 | 52,605 |
Total Working Age Population:
Total Households:
Total Working Age Population:
Total Households:
Total Working Age Population:
Total Households: