Retail Space
807 Lanier Drive Madison, IN 47250
807 Lanier Drive Madison, IN 47250

Details & Description
Property Highlights
• Turn Key opportunity with real estate and existing clientele
• Great start up business with instant cash flow
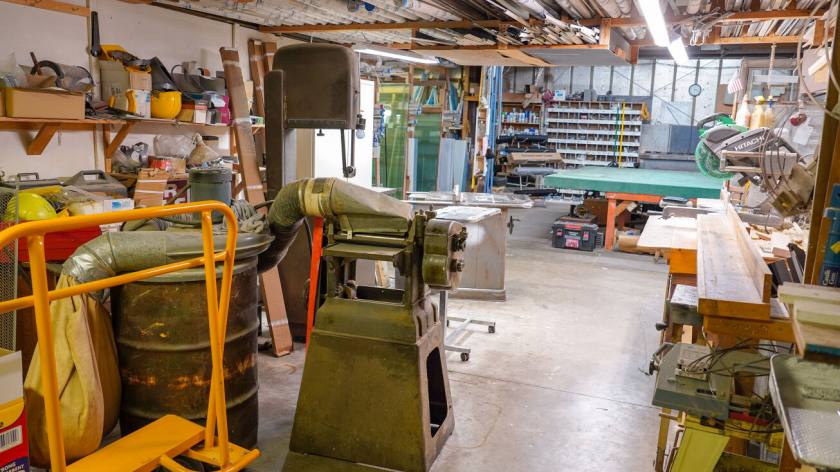
Additional Photos


Listing Agents

Stephanie Gilezan
O: 502-640-3622
commercial@gilezanteam.com
O: 502-640-3622
commercial@gilezanteam.com
While we strive to provide the most accurate information, all listing information, and demographic data, is provided by third-parties. As such, MyEListing will not be responsible for the accuracy of the information. It is strongly recommended that you verify all information with the listing agent, and any relevant agencies, prior to making any decisions.