Industrial Properties
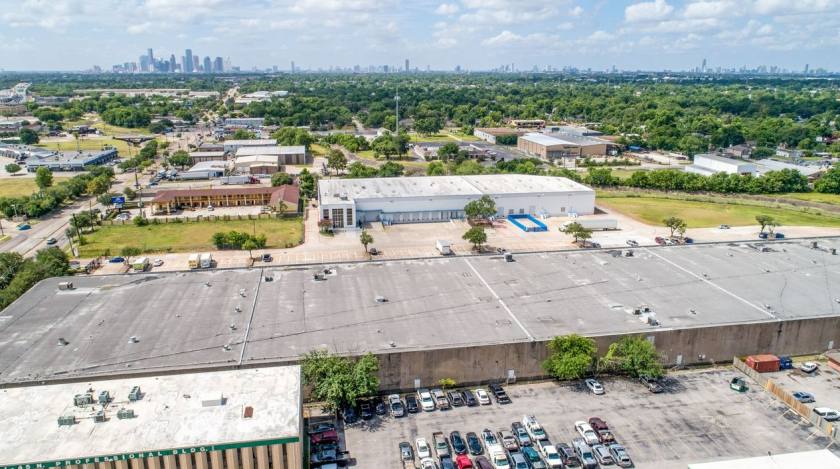
4525 Airline Drive Houston, TX 77022
4525 Airline Drive Houston, TX 77022
Details & Description
Property Highlights
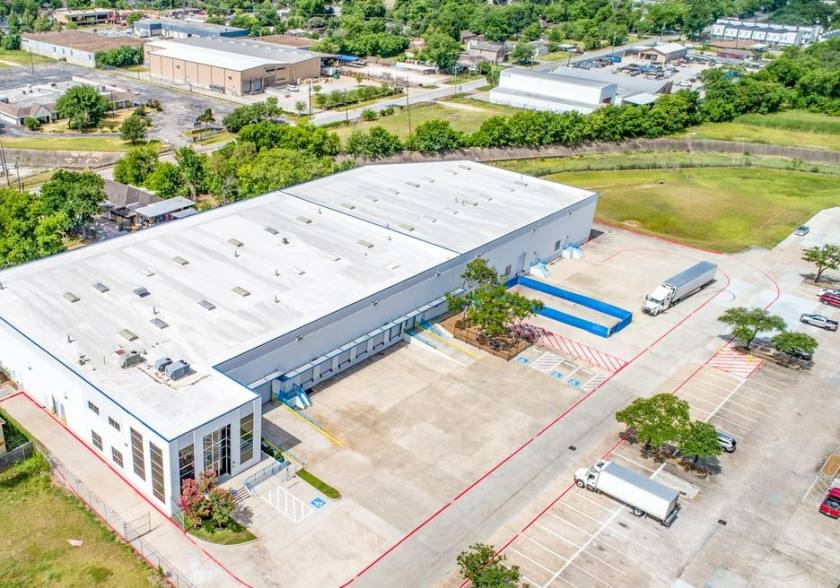
- • On 4.2 Acres
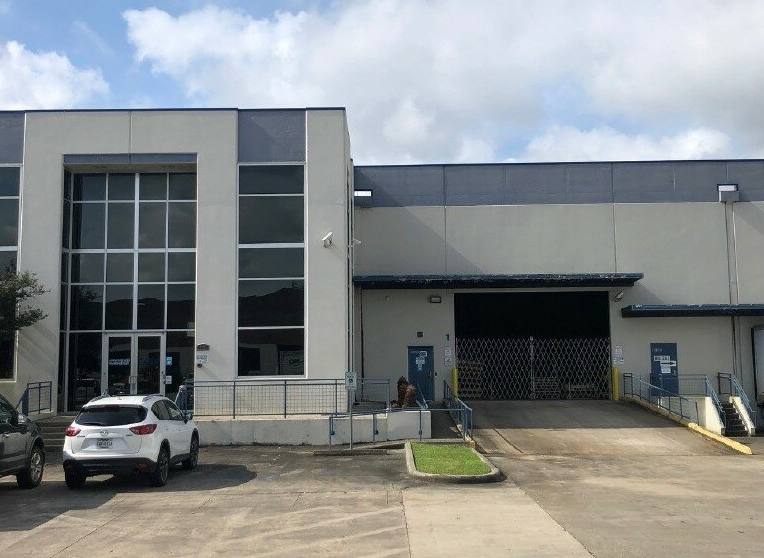
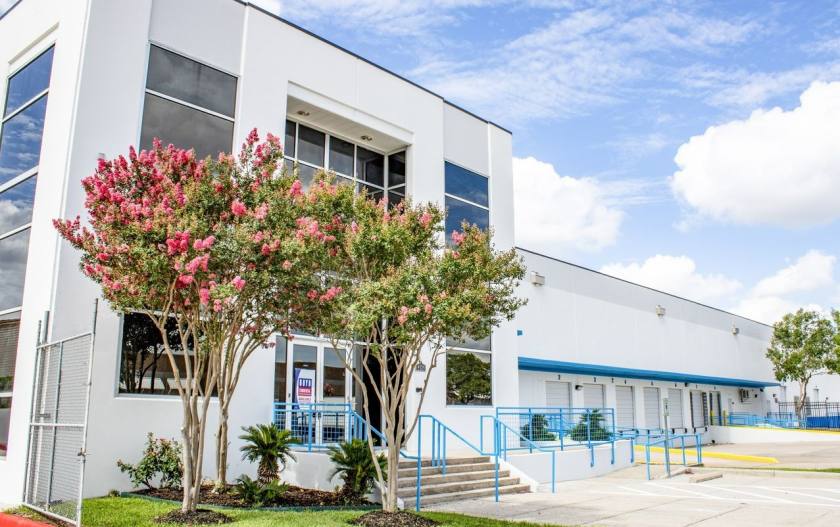
- • +/-2,700 SF of 1st Floor Office Area
- • +/-1,995 SF of 2nd Floor Office Area
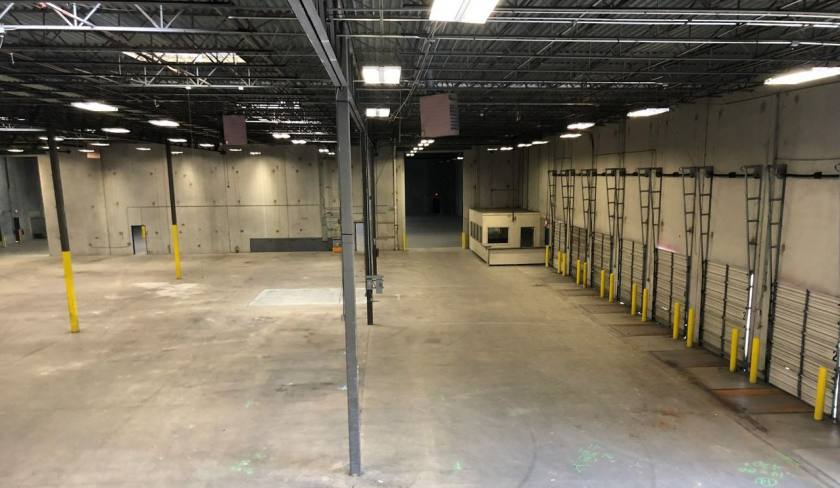
- • 26’ Clear Height
- • (8) Dock High Doors with Levelers
- • (2) Ramps
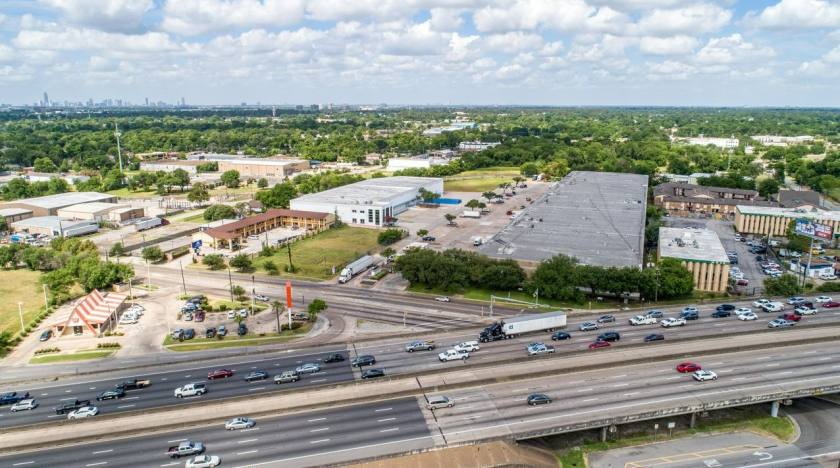
Additional Photos

Listing Agents

Conrad Bernard
O: 713-599-3424
cbernard@boydcommercial.net
O: 713-599-3424
cbernard@boydcommercial.net

David Boyd
O: 713-599-3454
dmboyd@boydcommercial.net
O: 713-599-3454
dmboyd@boydcommercial.net
While we strive to provide the most accurate information, all listing information, and demographic data, is provided by third-parties. As such, MyEListing will not be responsible for the accuracy of the information. It is strongly recommended that you verify all information with the listing agent, and any relevant agencies, prior to making any decisions.