Office Space
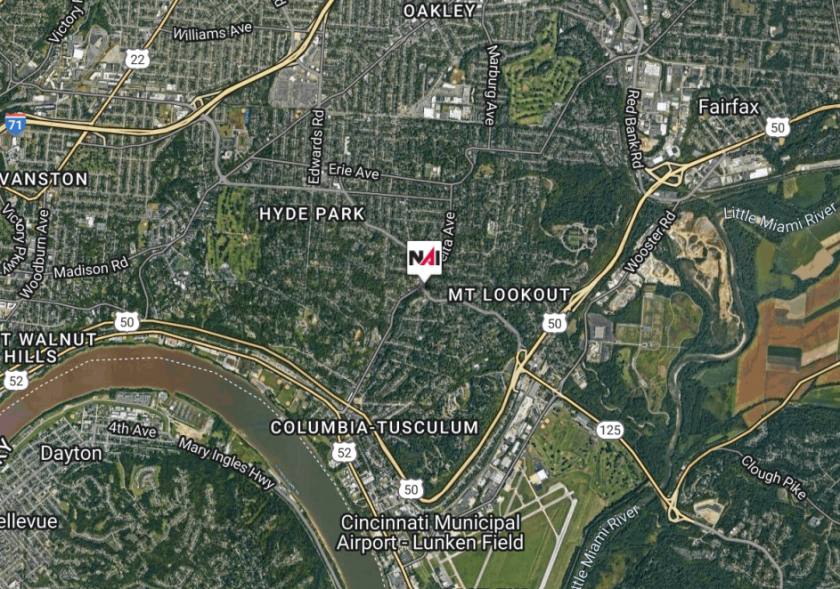
1018 Delta Avenue Cincinnati, OH 45208
1018 Delta Avenue Cincinnati, OH 45208

Details & Description
Property Highlights
- • Located in Highly Desirable Mt. Lookout Square
- • Off-Street Parking Available
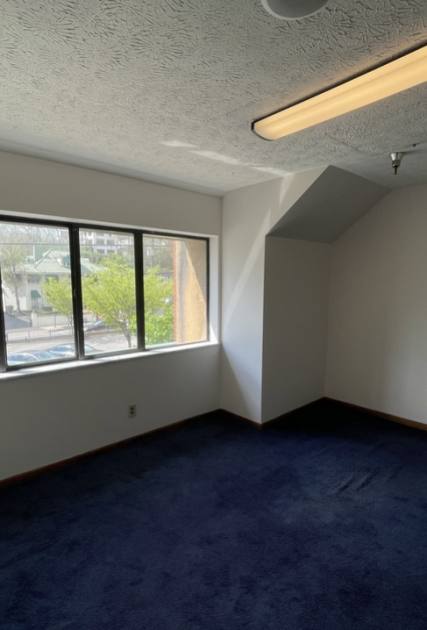
- • New Paint/Carpet Spaces Available
Additional Photos


Listing Agents

Gueorgui Chikov
O: 513-322-6317
M: 513-331-0920
gchikov@bergmancommercial.com
O: 513-322-6317
M: 513-331-0920
gchikov@bergmancommercial.com
While we strive to provide the most accurate information, all listing information, and demographic data, is provided by third-parties. As such, MyEListing will not be responsible for the accuracy of the information. It is strongly recommended that you verify all information with the listing agent, and any relevant agencies, prior to making any decisions.


