Located in Historic Brighton
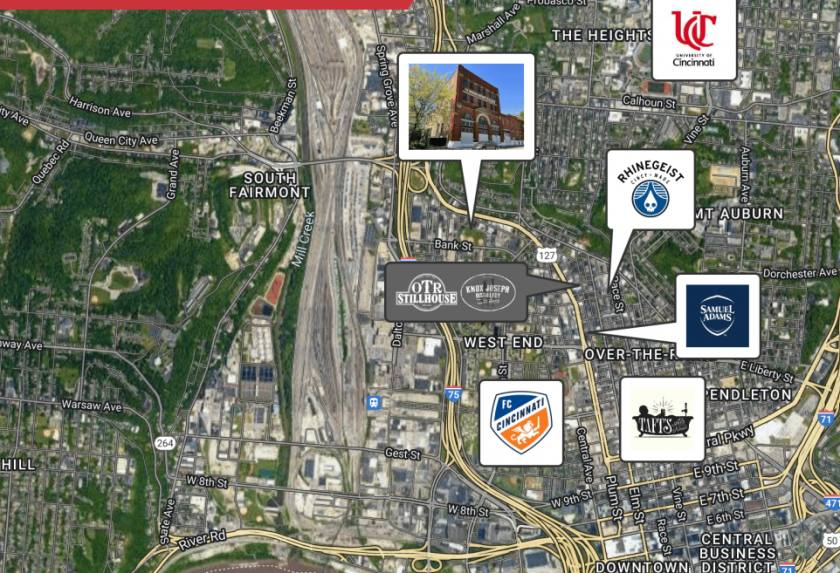
Easy Access from Central Parkway and I-75
Onsite Gated Parking Opportunity
Drive-In Accessibility and Dock 19,000 +/- SF
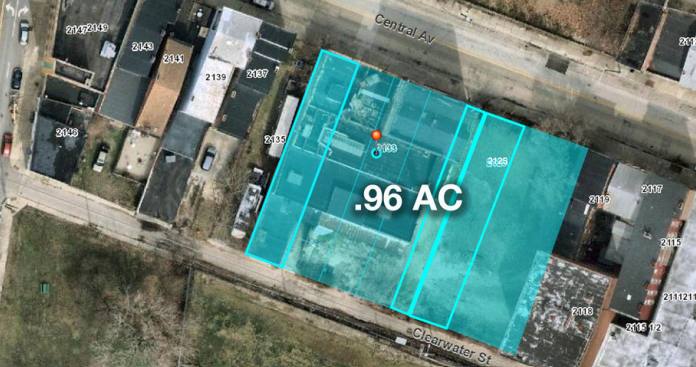
.96 Acres Across 3 Parcels
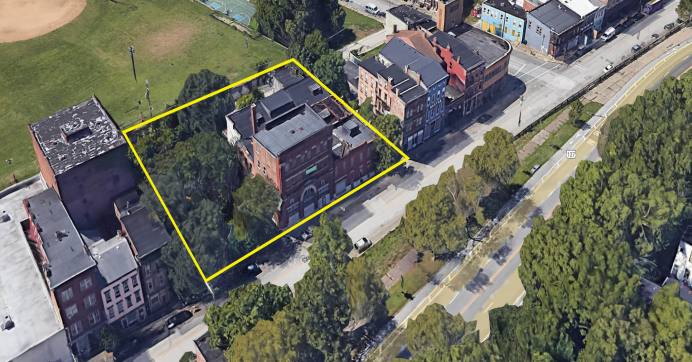
The 19,000+/- sf historic Germania Brewery Building provides a tremendous opportunity for redevelopment. Sitting on close to an acre, this asset provides onsite parking potential and/or outdoor patio/dining opportunities.
The 2133 Central Ave building was initially built as Germania Brewery in about 1880. In 1902, the name of the operation changed to the John Wetterer Brewery, which continued operation until prohibition hit in January 1920. The brewery closed and the property sat vacant for several years before becoming home to the Sterling Ice Cream Company, with the building then often referred to as the “The Ice Cream Factory." Sterling operated at the property through the1980s.
The brewery history of the property is significant as it was one of the larger and longer surviving breweries. In the day, Brighton was a vibrant self-sustaining neighborhood featuring most every type of shop needed to support its residents' livelihood and entertainment.
To this day, the building remains on the radar of the local brewery scene. The Hudy-14K run goes along Central Avenue in order to pass by and acknowledge the Germania Brewery Building. Additionally, the Brewery District's master plan has Central Avenue designated as the Germania Brewery District in their master expansion of the Brewery Heritage Trail because of the brewing history at 2133 Central.
No part of this information may be copied, reproduced, repurposed, or screen-captured for any commercial purpose without prior written authorization from MyEListing.
While we strive to provide the most accurate information, all listing information, and demographic data, is provided by third-parties. As such, MyEListing will not be responsible for the accuracy of the information. It is strongly recommended that you verify all information with the listing agent, and any relevant agencies, prior to making any decisions.
What is the building size of this Retail property in Cincinnati, OH?
The size of the building/unit at 2133 Central Avenue in Cincinnati is 19,000 square feet
How much land does the Cincinnati, OH property at 2133 Central Avenue include?
2133 Central Avenue in Cincinnati includes 0.960 acres of land
What kind of Retail is the propery at 2133 Central Avenue?
The property at 2133 Central Avenue Cincinnati, OH 45214 is listed as a Food Service Retail property
What is the population within 1 mile of 2133 Central Avenue in Cincinnati?
The population within 1 mile of 2133 Central Avenue Cincinnati, OH 45214 is 20,587 people.
Who do I contact for questions about 2133 Central Avenue?
You should contact the listing agent,
Gueorgui Chikov, for any details regarding this commercial listing.