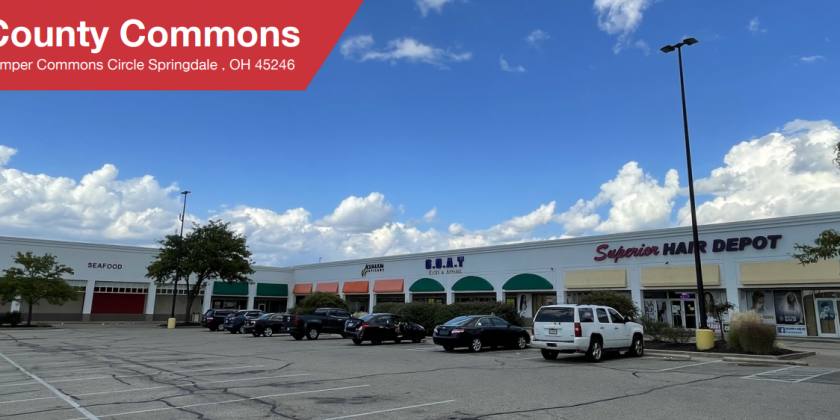
1-Mile | 3-Miles | 5-Miles | ||
---|---|---|---|---|
Total Population | 5,361 | 39,404 | 136,816 | |
Population Median Age | 37 | 38 | 39 | |
Population by Age | 0-9 Yrs | 1092 (20%) | 5240 (13%) | 18150 (13%) |
10-19 Yrs | 775 (14%) | 5476 (13%) | 17229 (12%) | |
20-29 Yrs | 562 (10%) | 5591 (14%) | 16914 (12%) | |
30-39 Yrs | 611 (11%) | 5445 (13%) | 18203 (13%) | |
40-49 Yrs | 504 (9%) | 4285 (10%) | 15614 (11%) | |
50-59 Yrs | 490 (9%) | 4258 (10%) | 17840 (13%) | |
60-69 Yrs | 416 (7%) | 4288 (10%) | 17403 (12%) | |
70+ Yrs | 910 (16%) | 4821 (12%) | 15465 (11%) | |
Median HH Income | $41,699 | $59,811 | $68,571 | |
Total Household Income | < 24K | 587 (27%) | 3422 (21%) | 8889 (16%) |
25-49K | 583 (27%) | 3562 (21%) | 10831 (19%) | |
50-74K | 311 (14%) | 3531 (21%) | 10768 (19%) | |
75-99K | 191 (9%) | 1959 (12%) | 7149 (12%) | |
100-199K | 319 (15%) | 3085 (18%) | 13122 (23%) | |
200K+ | 107 (5%) | 732 (4%) | 4646 (8%) | |
Highest Education Level | No Diploma | 509 | 2455 | 6870 |
Diploma or GED | 972 | 7854 | 25380 | |
Some College | 821 | 5686 | 17961 | |
Assoc. Degree | 265 | 2059 | 7080 | |
Bachelors Degree | 494 | 5057 | 21643 | |
Higher Degree | 267 | 3023 | 14522 | |
Total Housing Units | 2,200 | 17,506 | 58,680 | |
--Owner-Occupied | 855 | 7,870 | 34,606 | |
--Renter-Occupied | 1,243 | 8,421 | 20,798 | |
Owner-Occupied Values | < 100K | 272 | 2274 | 5835 |
100-199K | 458 | 3777 | 15583 | |
200-299K | 108 | 1035 | 7191 | |
300-399K | 5 | 343 | 3061 | |
400-499K | 4 | 130 | 1334 | |
500K+ | 8 | 310 | 1602 | |
Total Working Age Population | 3,876 | 30,764 | 107,724 | |
In Work Force | 2,399 | 20,028 | 71,537 | |
Not In Work Force | 1,476 | 10,736 | 36,187 | |
Workforce Employed | 2,226 | 18,991 | 68,135 | |
Workforce Unemployed | 173 | 1,026 | 3,378 | |
Civlian Workforce | 2,399 | 20,017 | 71,513 | |
Military Workforce | 0 | 11 | 25 | |
Total Households | 2,098 | 16,291 | 55,404 | |
Family Households | 1,170 | 9,094 | 34,775 | |
Non-Family Households | 928 | 7,196 | 20,629 | |
Married Couple | 616 | 5,285 | 24,532 | |
Other Family | 553 | 3,809 | 10,243 | |
Married w/Child | 298 | 2,120 | 9,926 | |
Single Male w/Child | 1 | 172 | 892 | |
Single Female w/Child | 237 | 2,067 | 4,798 |
Population Change Last Two Decades - Plus Projection
2000 | % | 2010 | % | 2020 | % | 2030 | |
---|---|---|---|---|---|---|---|
Ohio | 11,353,140 | +2 | 11,536,504 | 0 | 11,574,870 | 0 | 11,615,100 |
Hamilton County | 845,303 | -5 | 802,374 | -1 | 790,600 | -1 | 785,900 |
Butler County | 332,807 | +11 | 368,130 | +6 | 390,110 | +5 | 410,960 |
Total Working Age Population:
Total Households:
Total Working Age Population:
Total Households:
Total Working Age Population:
Total Households: