Commercial Land
Smith Road State Round 747 Hamilton, OH 45013
Smith Road State Round 747 Hamilton, OH 45013

Details & Description
Property Highlights
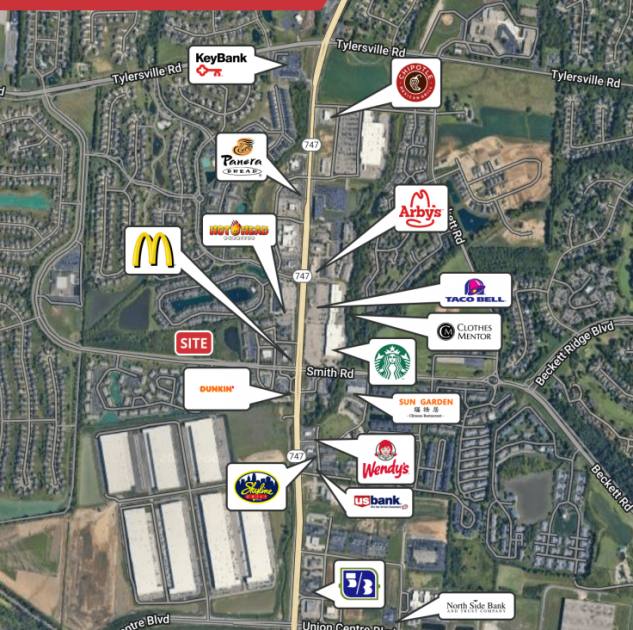
• Surrounded by Retailers like McDonalds, Starbucks, Penn Station, Dunkin and more
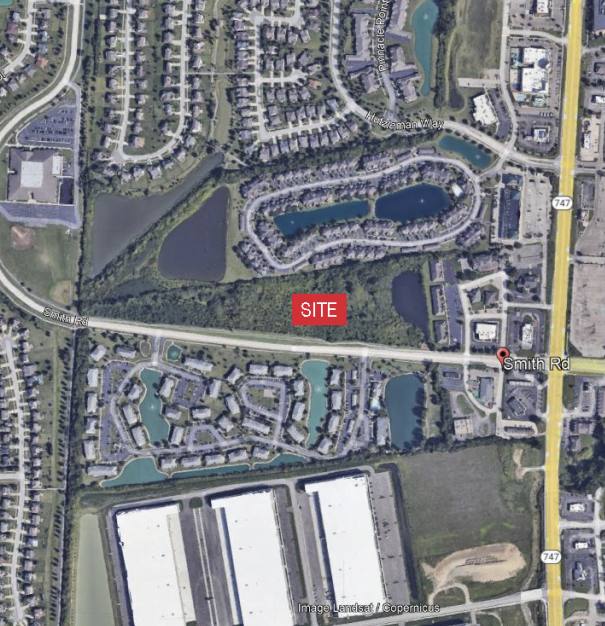
• 10.247 Acres for Sale at the Intersection of Smith Rd, and SR 747.
Additional Photos

Listing Agents

Gueorgui Chikov
O: 513-322-6317
M: 513-331-0920
gchikov@bergmancommercial.com
O: 513-322-6317
M: 513-331-0920
gchikov@bergmancommercial.com

Michael Bergman
O: 513-322-6309
M: 678-595-5954
mbergman@bergmancommercial.com
O: 513-322-6309
M: 678-595-5954
mbergman@bergmancommercial.com
While we strive to provide the most accurate information, all listing information, and demographic data, is provided by third-parties. As such, MyEListing will not be responsible for the accuracy of the information. It is strongly recommended that you verify all information with the listing agent, and any relevant agencies, prior to making any decisions.


