Commercial Land
1691 Ohio 125 Amelia, OH 45102
1691 Ohio 125 Amelia, OH 45102

Details & Description
Property Highlights
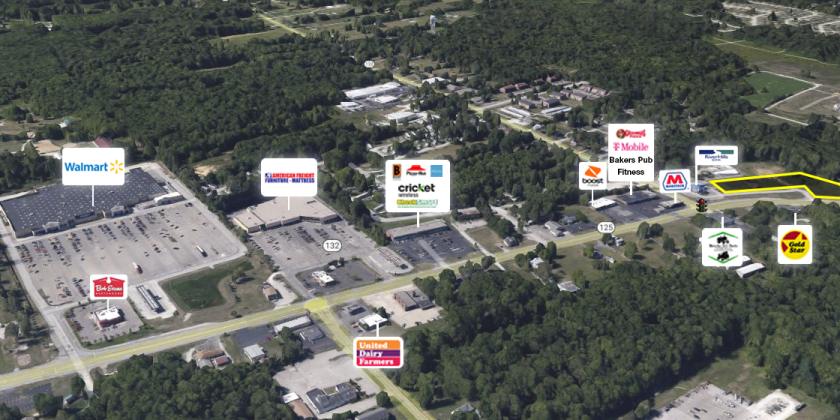
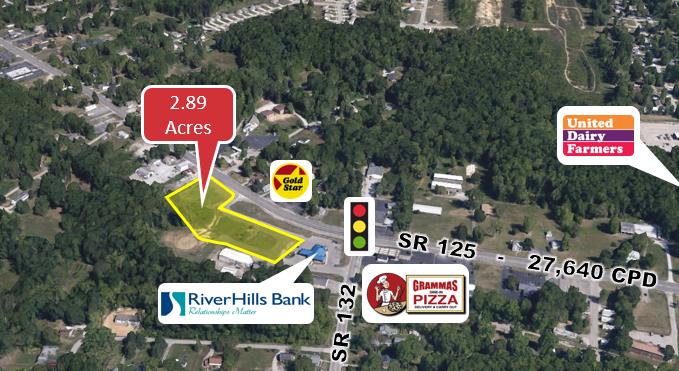
- • 2.89 +/- Acres Retail Land - Divisible
- • Ohio Pike (SR 125) @ SR 132
- • Amelia - Clermont County - Pierce Township
- • All Utilities - 550 Feet of Frontage
- • Traffic: 27,640 CPD
- • Asking Price: $650,000 or $250,000 / acre
Listing Agents

David Metz
O: 513-322-6302
M: 513-703-2204
dmetz@bergmancommercial.com
O: 513-322-6302
M: 513-703-2204
dmetz@bergmancommercial.com
While we strive to provide the most accurate information, all listing information, and demographic data, is provided by third-parties. As such, MyEListing will not be responsible for the accuracy of the information. It is strongly recommended that you verify all information with the listing agent, and any relevant agencies, prior to making any decisions.