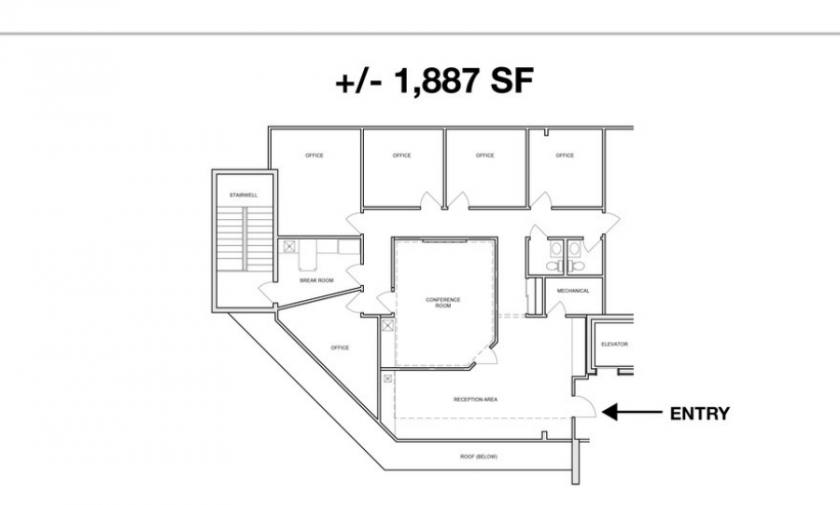
Office Space
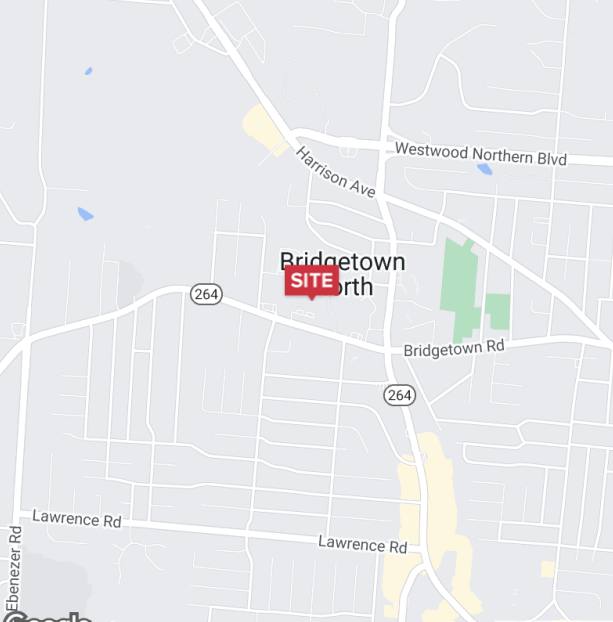
5636 Bridgetown Road Cincinnati, OH 45248
5636 Bridgetown Road Cincinnati, OH 45248

Details & Description
Property Highlights
- • Oakdale Park Office Condominiums
- • Beautifully Maintained Office Complex
- • Easy Access to Restaurants and Shopping
- • Great for Professional or Medical Office Use
- • PRICE REDUCED: $150,000
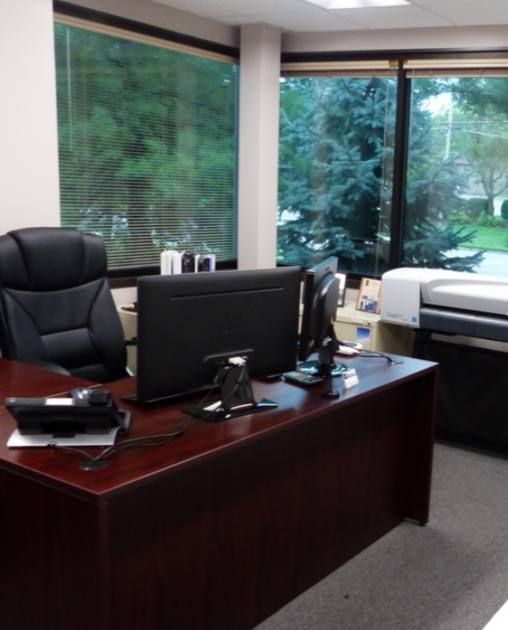
Additional Photos


Listing Agents

Cindy Metz
O: 513-322-6303
M: 513-207-3368
cmetz@bergmancommercial.com
O: 513-322-6303
M: 513-207-3368
cmetz@bergmancommercial.com
While we strive to provide the most accurate information, all listing information, and demographic data, is provided by third-parties. As such, MyEListing will not be responsible for the accuracy of the information. It is strongly recommended that you verify all information with the listing agent, and any relevant agencies, prior to making any decisions.