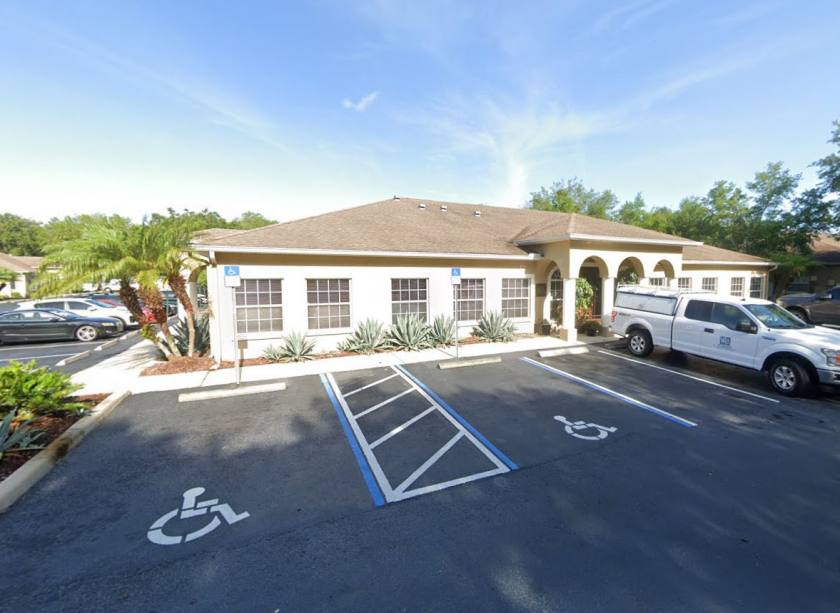
1-Mile | 3-Miles | 5-Miles | ||
---|---|---|---|---|
Total Population | 14,666 | 111,887 | 312,175 | |
Population Median Age | 36 | 40 | 39 | |
Population by Age | 0-9 Yrs | 1601 (10%) | 13012 (11%) | 36998 (11%) |
10-19 Yrs | 1515 (10%) | 11544 (10%) | 32976 (10%) | |
20-29 Yrs | 2505 (17%) | 14613 (13%) | 43596 (13%) | |
30-39 Yrs | 2865 (19%) | 17793 (15%) | 48062 (15%) | |
40-49 Yrs | 2387 (16%) | 16216 (14%) | 43176 (13%) | |
50-59 Yrs | 1820 (12%) | 14951 (13%) | 42438 (13%) | |
60-69 Yrs | 1141 (7%) | 12523 (11%) | 34342 (11%) | |
70+ Yrs | 831 (5%) | 11234 (10%) | 30585 (9%) | |
Median HH Income | $55,228 | $54,584 | $52,203 | |
Total Household Income | < 24K | 1120 (18%) | 8114 (19%) | 26310 (22%) |
25-49K | 1423 (23%) | 10554 (24%) | 30013 (25%) | |
50-74K | 1614 (27%) | 9945 (23%) | 24361 (20%) | |
75-99K | 682 (11%) | 4860 (11%) | 13141 (11%) | |
100-199K | 965 (16%) | 6989 (16%) | 19158 (16%) | |
200K+ | 164 (2%) | 1834 (4%) | 4987 (4%) | |
Highest Education Level | No Diploma | 1503 | 10020 | 30633 |
Diploma or GED | 2812 | 25259 | 69151 | |
Some College | 1917 | 13516 | 39318 | |
Assoc. Degree | 1121 | 7538 | 20638 | |
Bachelors Degree | 2244 | 16447 | 42991 | |
Higher Degree | 1103 | 8121 | 20807 | |
Total Housing Units | 6,319 | 44,967 | 127,055 | |
--Owner-Occupied | 2,419 | 24,583 | 64,943 | |
--Renter-Occupied | 3,550 | 17,714 | 53,027 | |
Owner-Occupied Values | < 100K | 303 | 2517 | 9464 |
100-199K | 935 | 8598 | 20719 | |
200-299K | 602 | 7348 | 20414 | |
300-399K | 212 | 3256 | 7769 | |
400-499K | 196 | 1509 | 3031 | |
500K+ | 171 | 1355 | 3546 | |
Total Working Age Population | 12,246 | 92,258 | 255,567 | |
In Work Force | 9,481 | 62,251 | 169,404 | |
Not In Work Force | 2,765 | 30,008 | 86,162 | |
Workforce Employed | 8,390 | 58,165 | 159,893 | |
Workforce Unemployed | 981 | 3,878 | 9,105 | |
Civlian Workforce | 9,371 | 62,043 | 168,999 | |
Military Workforce | 110 | 207 | 406 | |
Total Households | 5,969 | 42,298 | 117,969 | |
Family Households | 3,448 | 26,504 | 71,713 | |
Non-Family Households | 2,521 | 15,794 | 46,256 | |
Married Couple | 2,017 | 17,121 | 46,180 | |
Other Family | 1,432 | 9,383 | 25,533 | |
Married w/Child | 753 | 5,897 | 16,875 | |
Single Male w/Child | 215 | 1,331 | 3,216 | |
Single Female w/Child | 563 | 3,364 | 9,706 |
Population Change Last Two Decades - Plus Projection
2000 | % | 2010 | % | 2020 | % | 2030 | |
---|---|---|---|---|---|---|---|
Florida | 15,982,378 | +18 | 18,801,310 | +14 | 21,517,610 | +13 | 24,340,457 |
Hillsborough County | 998,948 | +23 | 1,229,226 | +19 | 1,466,803 | +16 | 1,708,550 |
Total Working Age Population:
Total Households:
Total Working Age Population:
Total Households:
Total Working Age Population:
Total Households: