Office Space
703 Ohio 28 Milford, OH 45150
703 Ohio 28 Milford, OH 45150

Details & Description
Property Highlights
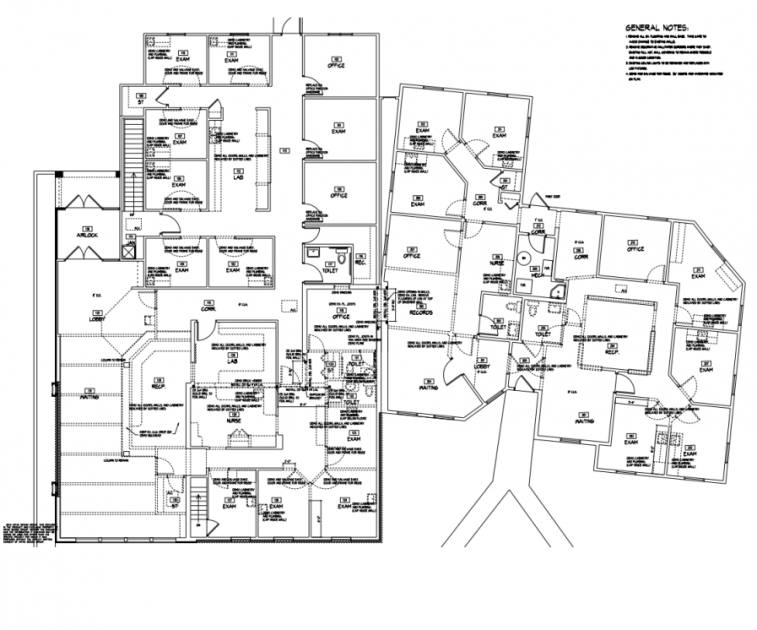
- • Large Medical/Professional Office Building
- • 18 Exam Rooms and 5 Private Offices
- • Laboratory and Multiple Waiting Rooms
- • Full Building Renovation in 2016
Additional Photos


Listing Agents

Cindy Metz
O: 513-322-6303
M: 513-207-3368
cmetz@bergmancommercial.com
O: 513-322-6303
M: 513-207-3368
cmetz@bergmancommercial.com
While we strive to provide the most accurate information, all listing information, and demographic data, is provided by third-parties. As such, MyEListing will not be responsible for the accuracy of the information. It is strongly recommended that you verify all information with the listing agent, and any relevant agencies, prior to making any decisions.