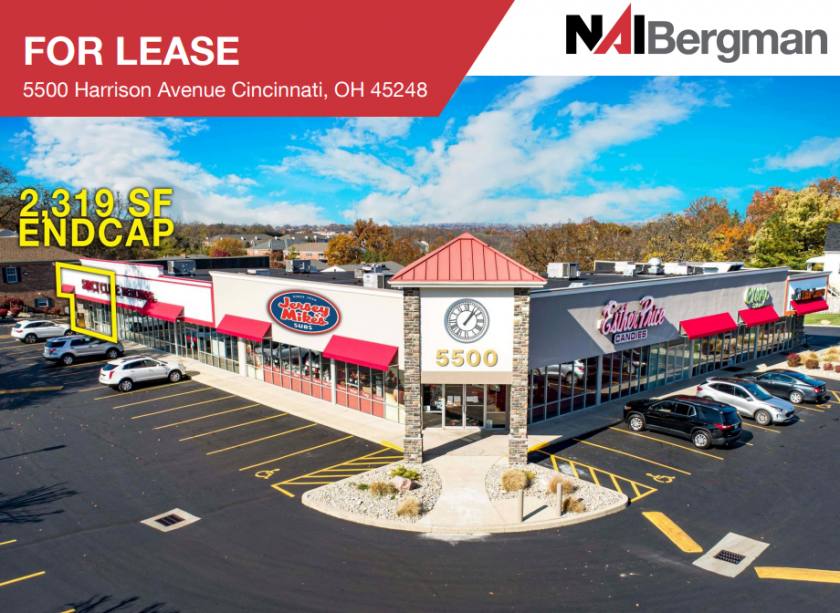
1-Mile | 3-Miles | 5-Miles | ||
---|---|---|---|---|
Total Population | 11,702 | 75,709 | 204,896 | |
Population Median Age | 38 | 38 | 37 | |
Population by Age | 0-9 Yrs | 1653 (14%) | 10740 (14%) | 30753 (15%) |
10-19 Yrs | 1521 (12%) | 9980 (13%) | 26783 (13%) | |
20-29 Yrs | 1492 (12%) | 9012 (11%) | 26088 (12%) | |
30-39 Yrs | 1846 (15%) | 11266 (14%) | 29157 (14%) | |
40-49 Yrs | 1428 (12%) | 8596 (11%) | 23480 (11%) | |
50-59 Yrs | 1275 (10%) | 10071 (13%) | 26544 (12%) | |
60-69 Yrs | 1196 (10%) | 8199 (10%) | 22234 (10%) | |
70+ Yrs | 1292 (11%) | 7844 (10%) | 19857 (9%) | |
Median HH Income | $60,948 | $59,003 | $53,706 | |
Total Household Income | < 24K | 765 (16%) | 5823 (18%) | 19381 (23%) |
25-49K | 1091 (23%) | 7712 (24%) | 20433 (24%) | |
50-74K | 1140 (24%) | 6064 (19%) | 14289 (17%) | |
75-99K | 819 (17%) | 3851 (12%) | 10142 (12%) | |
100-199K | 686 (14%) | 6269 (19%) | 16330 (19%) | |
200K+ | 168 (3%) | 1736 (5%) | 3476 (4%) | |
Highest Education Level | No Diploma | 585 | 3782 | 12922 |
Diploma or GED | 2813 | 16292 | 43732 | |
Some College | 1606 | 9796 | 27554 | |
Assoc. Degree | 881 | 4948 | 12586 | |
Bachelors Degree | 1281 | 11120 | 27121 | |
Higher Degree | 672 | 5590 | 12880 | |
Total Housing Units | 4,938 | 34,327 | 92,391 | |
--Owner-Occupied | 3,356 | 20,382 | 50,130 | |
--Renter-Occupied | 1,312 | 11,074 | 33,921 | |
Owner-Occupied Values | < 100K | 1088 | 4722 | 12648 |
100-199K | 1892 | 10147 | 23535 | |
200-299K | 291 | 3193 | 8213 | |
300-399K | 39 | 1261 | 3654 | |
400-499K | 18 | 564 | 1089 | |
500K+ | 28 | 494 | 991 | |
Total Working Age Population | 9,009 | 58,731 | 157,281 | |
In Work Force | 6,163 | 40,402 | 106,009 | |
Not In Work Force | 2,845 | 18,329 | 51,272 | |
Workforce Employed | 5,850 | 38,471 | 99,781 | |
Workforce Unemployed | 311 | 1,923 | 6,214 | |
Civlian Workforce | 6,161 | 40,394 | 105,994 | |
Military Workforce | 2 | 8 | 15 | |
Total Households | 4,668 | 31,455 | 84,050 | |
Family Households | 2,663 | 18,768 | 51,118 | |
Non-Family Households | 2,005 | 12,687 | 32,933 | |
Married Couple | 1,764 | 12,538 | 32,728 | |
Other Family | 900 | 6,230 | 18,390 | |
Married w/Child | 789 | 4,714 | 12,953 | |
Single Male w/Child | 208 | 1,046 | 2,601 | |
Single Female w/Child | 229 | 2,690 | 8,336 |
Population Change Last Two Decades - Plus Projection
2000 | % | 2010 | % | 2020 | % | 2030 | |
---|---|---|---|---|---|---|---|
Kentucky | 4,041,769 | +7 | 4,339,367 | +4 | 4,533,464 | +4 | 4,726,382 |
Boone County | 85,991 | +38 | 118,811 | +17 | 139,018 | +18 | 163,722 |
Ohio | 11,353,140 | +2 | 11,536,504 | 0 | 11,574,870 | 0 | 11,615,100 |
Hamilton County | 845,303 | -5 | 802,374 | -1 | 790,600 | -1 | 785,900 |
Total Working Age Population:
Total Households:
Total Working Age Population:
Total Households:
Total Working Age Population:
Total Households: