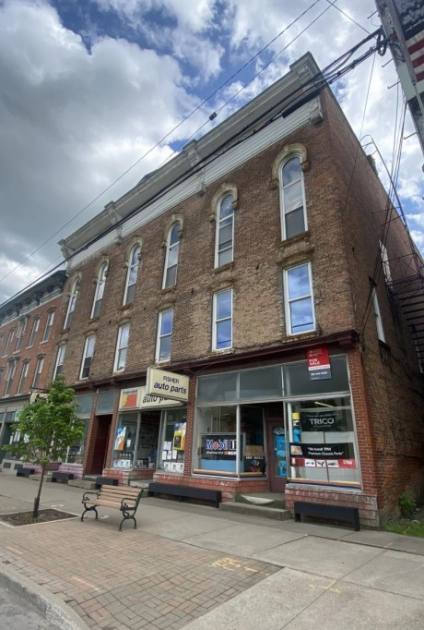
Retail Space
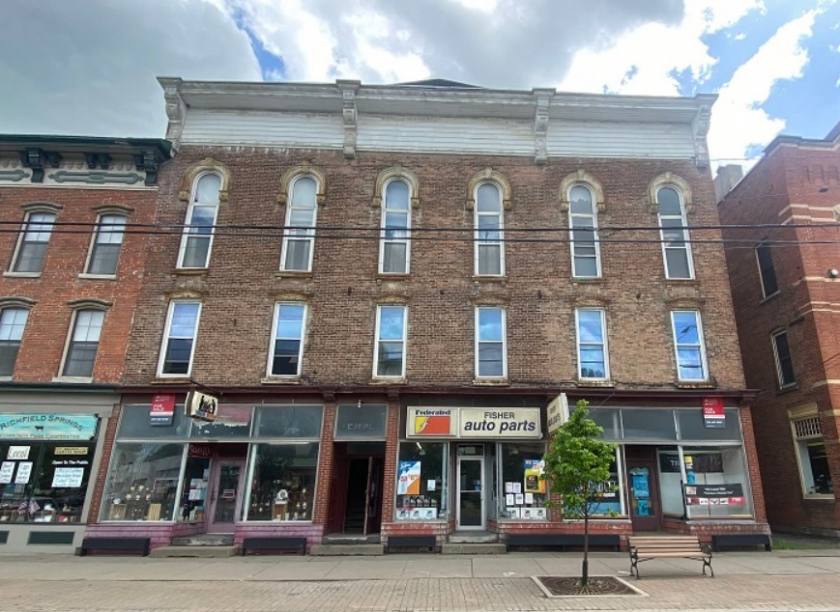
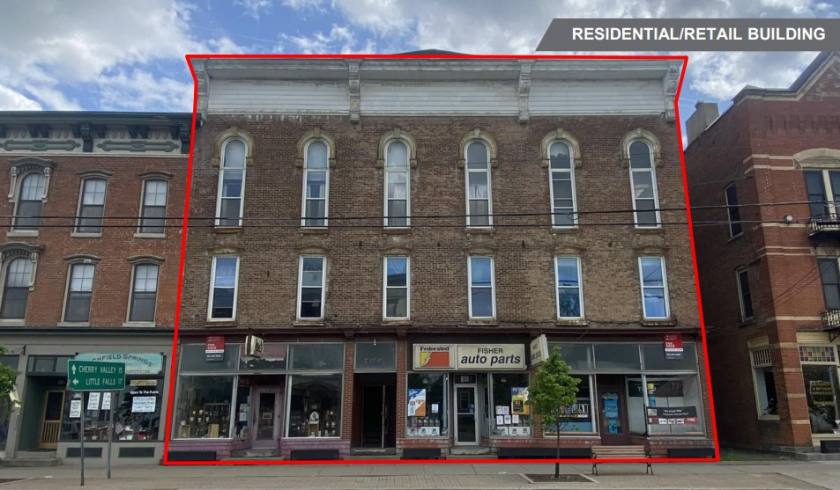
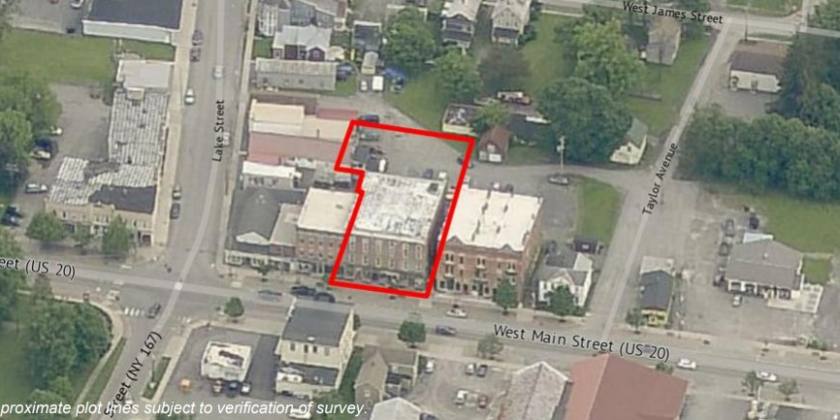
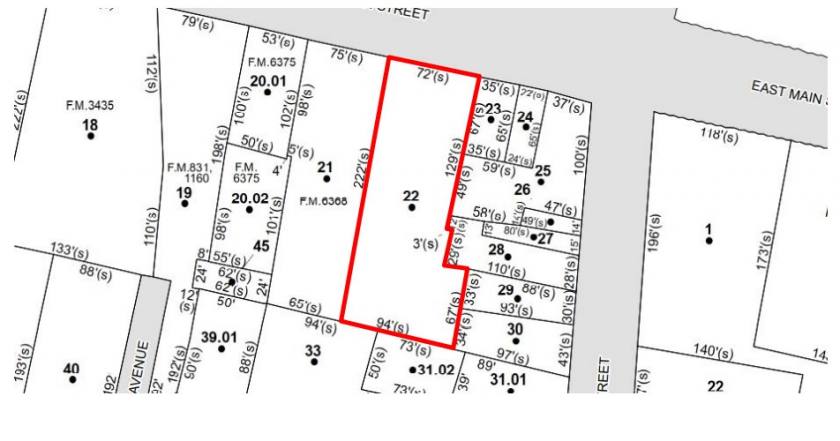
138 West Main Street Richfield Springs, NY 13439
138 West Main Street Richfield Springs, NY 13439
Details & Description
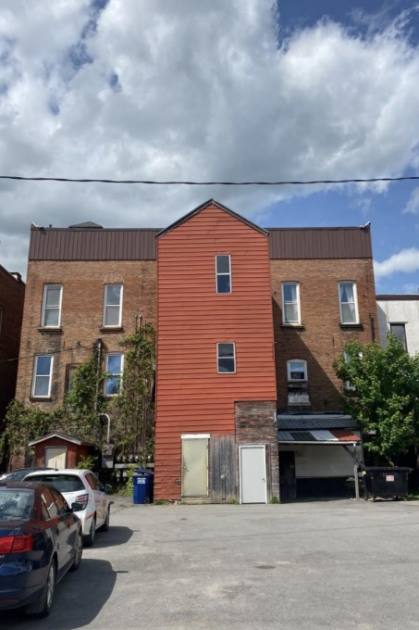
Additional Photos
Listing Agents

James Dylan Furney
O: 315-225-8571
M: 315-225-8571
jfurney@pyramidbrokerage.com
O: 315-225-8571
M: 315-225-8571
jfurney@pyramidbrokerage.com

Kathryn Saraceno
O: 315-736-0856
M: 315-335-7710
ksaraceno@pyramidbrokerage.com
O: 315-736-0856
M: 315-335-7710
ksaraceno@pyramidbrokerage.com
While we strive to provide the most accurate information, all listing information, and demographic data, is provided by third-parties. As such, MyEListing will not be responsible for the accuracy of the information. It is strongly recommended that you verify all information with the listing agent, and any relevant agencies, prior to making any decisions.