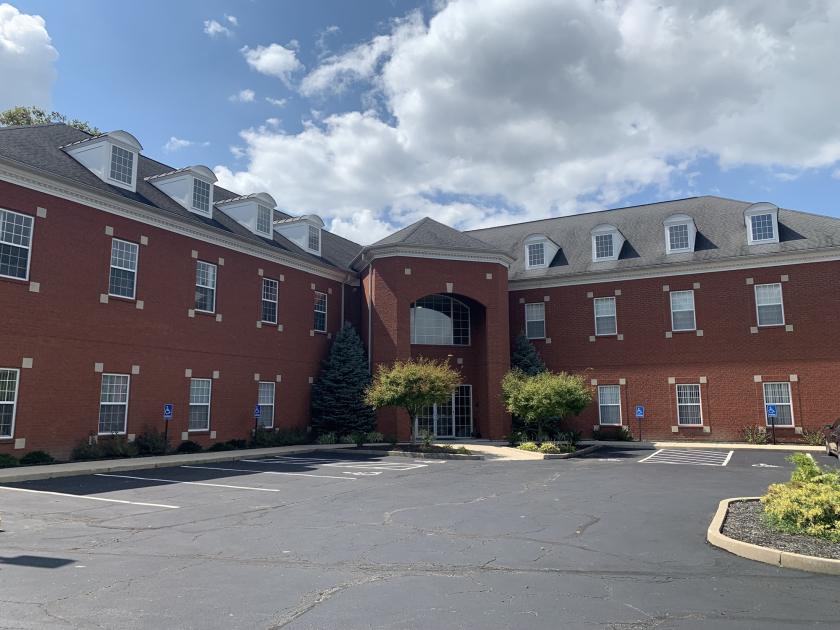
1-Mile | 3-Miles | 5-Miles | ||
---|---|---|---|---|
Total Population | 10,179 | 75,712 | 176,801 | |
Population Median Age | 39 | 40 | 39 | |
Population by Age | 0-9 Yrs | 1572 (15%) | 10163 (13%) | 24564 (13%) |
10-19 Yrs | 1002 (9%) | 8832 (11%) | 22211 (12%) | |
20-29 Yrs | 1763 (17%) | 9468 (12%) | 22038 (12%) | |
30-39 Yrs | 1127 (11%) | 9741 (12%) | 23635 (13%) | |
40-49 Yrs | 940 (9%) | 8505 (11%) | 19857 (11%) | |
50-59 Yrs | 1239 (12%) | 11057 (14%) | 24730 (13%) | |
60-69 Yrs | 1408 (13%) | 9633 (12%) | 21477 (12%) | |
70+ Yrs | 1127 (11%) | 8313 (10%) | 18289 (10%) | |
Median HH Income | $59,173 | $58,068 | $56,365 | |
Total Household Income | < 24K | 418 (9%) | 5907 (18%) | 15178 (20%) |
25-49K | 1476 (34%) | 7657 (24%) | 17574 (24%) | |
50-74K | 694 (16%) | 6172 (19%) | 14147 (19%) | |
75-99K | 639 (15%) | 4254 (13%) | 9779 (13%) | |
100-199K | 883 (20%) | 6316 (20%) | 14027 (19%) | |
200K+ | 130 (3%) | 1052 (3%) | 2455 (3%) | |
Highest Education Level | No Diploma | 839 | 4267 | 9243 |
Diploma or GED | 1951 | 17365 | 38280 | |
Some College | 2072 | 12131 | 27277 | |
Assoc. Degree | 571 | 5353 | 12525 | |
Bachelors Degree | 1281 | 9884 | 22972 | |
Higher Degree | 372 | 3753 | 10461 | |
Total Housing Units | 4,393 | 33,178 | 79,224 | |
--Owner-Occupied | 2,711 | 21,145 | 46,716 | |
--Renter-Occupied | 1,528 | 10,213 | 26,443 | |
Owner-Occupied Values | < 100K | 466 | 6691 | 14861 |
100-199K | 1591 | 9828 | 21648 | |
200-299K | 340 | 2728 | 6106 | |
300-399K | 184 | 1147 | 2692 | |
400-499K | 40 | 395 | 686 | |
500K+ | 89 | 357 | 724 | |
Total Working Age Population | 8,040 | 60,051 | 137,574 | |
In Work Force | 5,636 | 40,132 | 92,149 | |
Not In Work Force | 2,404 | 19,919 | 45,424 | |
Workforce Employed | 5,470 | 38,134 | 87,099 | |
Workforce Unemployed | 166 | 1,998 | 5,010 | |
Civlian Workforce | 5,636 | 40,132 | 92,108 | |
Military Workforce | 0 | 0 | 41 | |
Total Households | 4,239 | 31,358 | 73,160 | |
Family Households | 2,359 | 20,035 | 45,433 | |
Non-Family Households | 1,881 | 11,323 | 27,727 | |
Married Couple | 1,656 | 12,765 | 28,206 | |
Other Family | 703 | 7,270 | 17,227 | |
Married w/Child | 625 | 4,343 | 9,805 | |
Single Male w/Child | 169 | 1,079 | 2,120 | |
Single Female w/Child | 79 | 2,497 | 7,722 |
Population Change Last Two Decades - Plus Projection
2000 | % | 2010 | % | 2020 | % | 2030 | |
---|---|---|---|---|---|---|---|
Ohio | 11,353,140 | +2 | 11,536,504 | 0 | 11,574,870 | 0 | 11,615,100 |
Hamilton County | 845,303 | -5 | 802,374 | -1 | 790,600 | -1 | 785,900 |
Total Working Age Population:
Total Households:
Total Working Age Population:
Total Households:
Total Working Age Population:
Total Households: