Commercial Land
412 Central Avenue Newport, KY 41071
412 Central Avenue Newport, KY 41071

Details & Description
Property Highlights
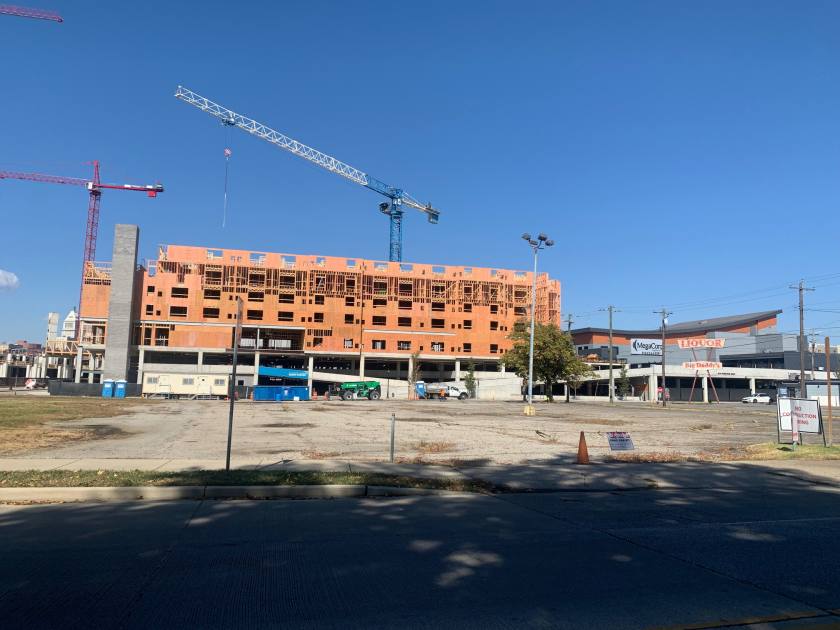
- • 1.29 Acres Directly Across Ovation Development
- • Walking Distance to Newport On The Levee
- • Zoning: Riverfront District RDF
Additional Photos


Listing Agents

Billy Gillman
O: 513-322-6319
M: 513-604-4530
billy@bergmancommercial.com
O: 513-322-6319
M: 513-604-4530
billy@bergmancommercial.com
While we strive to provide the most accurate information, all listing information, and demographic data, is provided by third-parties. As such, MyEListing will not be responsible for the accuracy of the information. It is strongly recommended that you verify all information with the listing agent, and any relevant agencies, prior to making any decisions.


