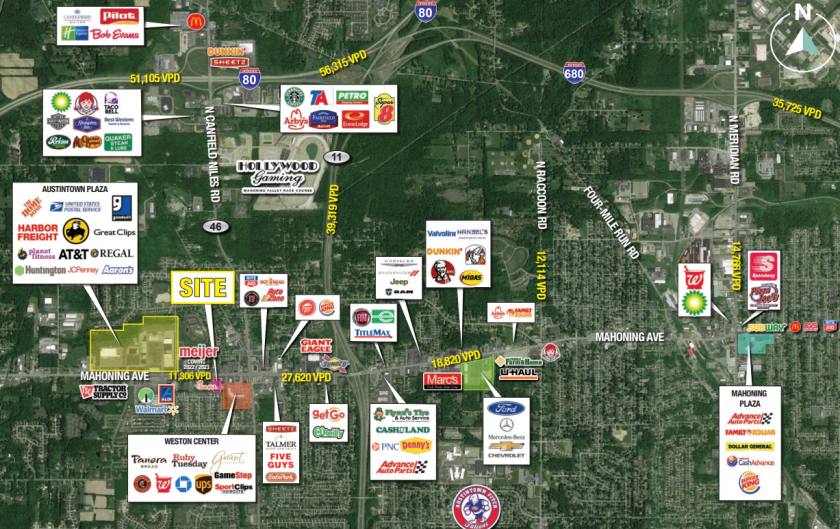
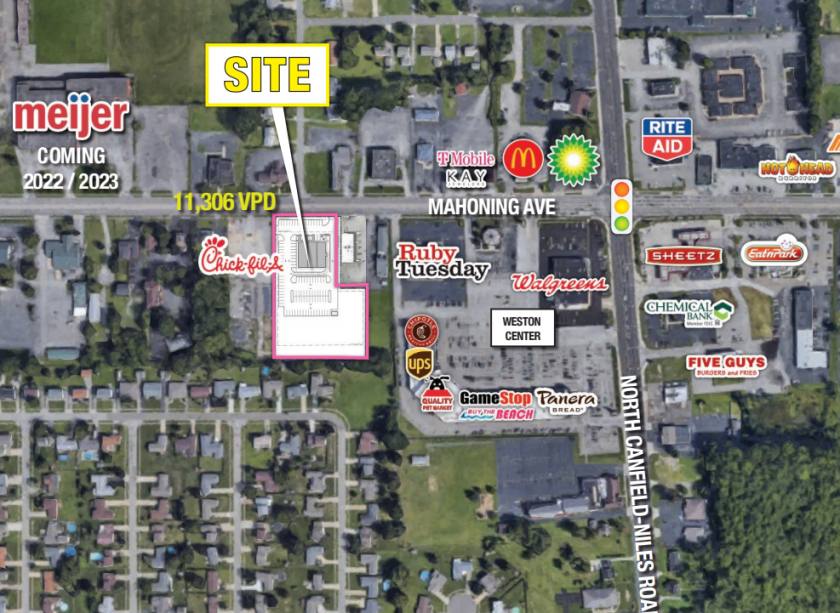
1-Mile | 3-Miles | 5-Miles | ||
---|---|---|---|---|
Total Population | 5,596 | 34,254 | 77,128 | |
Population Median Age | 44 | 43 | 43 | |
Population by Age | 0-9 Yrs | 337 (6%) | 3119 (9%) | 7553 (9%) |
10-19 Yrs | 610 (10%) | 3680 (10%) | 9087 (11%) | |
20-29 Yrs | 873 (15%) | 4763 (13%) | 9341 (12%) | |
30-39 Yrs | 645 (11%) | 4300 (12%) | 8861 (11%) | |
40-49 Yrs | 794 (14%) | 4329 (12%) | 9466 (12%) | |
50-59 Yrs | 659 (11%) | 4237 (12%) | 10585 (13%) | |
60-69 Yrs | 655 (11%) | 4698 (13%) | 11291 (14%) | |
70+ Yrs | 1022 (18%) | 5129 (14%) | 10944 (14%) | |
Median HH Income | $52,750 | $49,393 | $49,092 | |
Total Household Income | < 24K | 497 (19%) | 3100 (20%) | 7910 (23%) |
25-49K | 692 (27%) | 4703 (30%) | 9460 (27%) | |
50-74K | 420 (16%) | 2757 (17%) | 6218 (18%) | |
75-99K | 566 (22%) | 2379 (15%) | 4779 (14%) | |
100-199K | 282 (11%) | 2109 (13%) | 4757 (13%) | |
200K+ | 42 (1%) | 312 (2%) | 920 (2%) | |
Highest Education Level | No Diploma | 298 | 1507 | 4447 |
Diploma or GED | 1866 | 10624 | 22142 | |
Some College | 686 | 5351 | 11840 | |
Assoc. Degree | 427 | 2025 | 4525 | |
Bachelors Degree | 566 | 3697 | 8752 | |
Higher Degree | 313 | 1798 | 4115 | |
Total Housing Units | 2,693 | 16,789 | 37,335 | |
--Owner-Occupied | 1,897 | 10,603 | 24,549 | |
--Renter-Occupied | 602 | 4,758 | 9,496 | |
Owner-Occupied Values | < 100K | 725 | 4327 | 12213 |
100-199K | 955 | 5177 | 8623 | |
200-299K | 179 | 798 | 2312 | |
300-399K | 14 | 134 | 741 | |
400-499K | 6 | 112 | 368 | |
500K+ | 17 | 55 | 291 | |
Total Working Age Population | 5,023 | 29,179 | 63,967 | |
In Work Force | 3,086 | 18,838 | 39,644 | |
Not In Work Force | 1,937 | 10,341 | 24,323 | |
Workforce Employed | 3,000 | 17,601 | 36,976 | |
Workforce Unemployed | 86 | 1,233 | 2,639 | |
Civlian Workforce | 3,086 | 18,834 | 39,616 | |
Military Workforce | 0 | 5 | 28 | |
Total Households | 2,499 | 15,361 | 34,044 | |
Family Households | 1,381 | 9,191 | 20,552 | |
Non-Family Households | 1,118 | 6,170 | 13,493 | |
Married Couple | 1,177 | 6,894 | 14,431 | |
Other Family | 205 | 2,297 | 6,121 | |
Married w/Child | 430 | 2,230 | 4,577 | |
Single Male w/Child | 18 | 337 | 816 | |
Single Female w/Child | 44 | 783 | 2,395 |
Population Change Last Two Decades - Plus Projection
2000 | % | 2010 | % | 2020 | % | 2030 | |
---|---|---|---|---|---|---|---|
Ohio | 11,353,140 | +2 | 11,536,504 | 0 | 11,574,870 | 0 | 11,615,100 |
Trumbull County | 225,116 | -7 | 210,312 | -5 | 200,840 | -4 | 193,360 |
Mahoning County | 257,555 | -7 | 238,823 | -6 | 224,680 | -6 | 212,240 |
Total Working Age Population:
Total Households:
Total Working Age Population:
Total Households:
Total Working Age Population:
Total Households: