Flex-Office-Warehouse
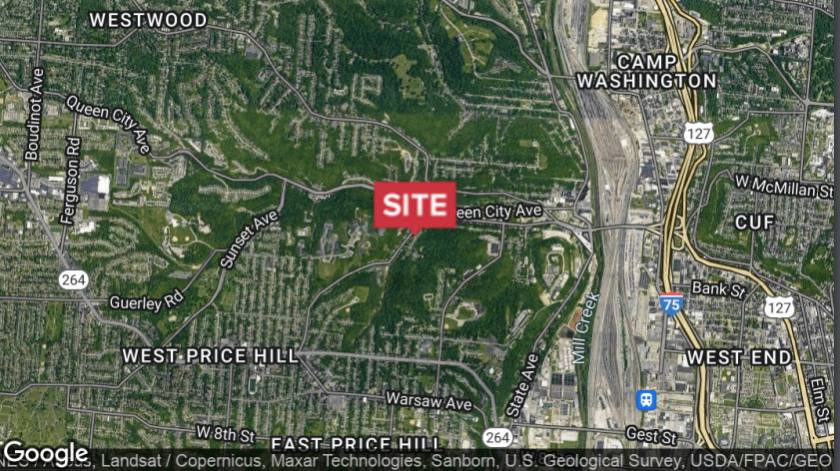
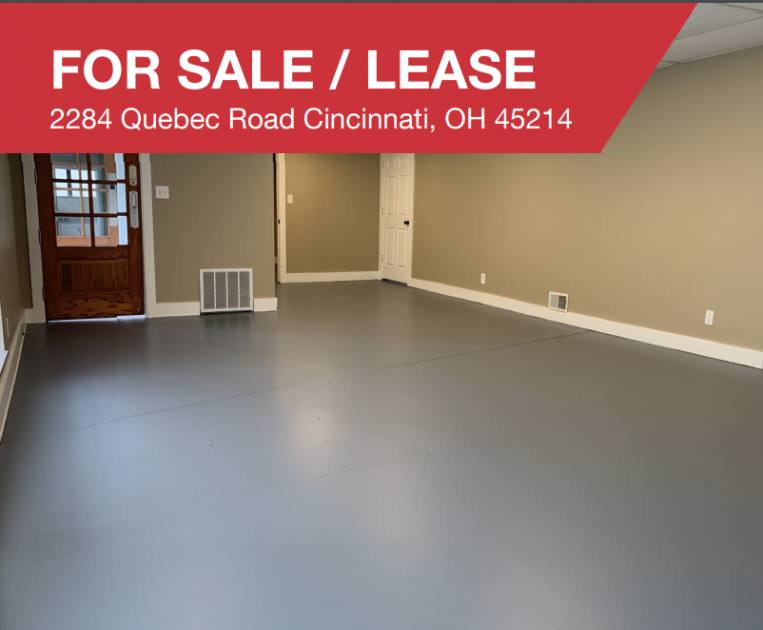
2284 Quebec Road Cincinnati, OH 45214
2284 Quebec Road Cincinnati, OH 45214

Details & Description
Property Highlights
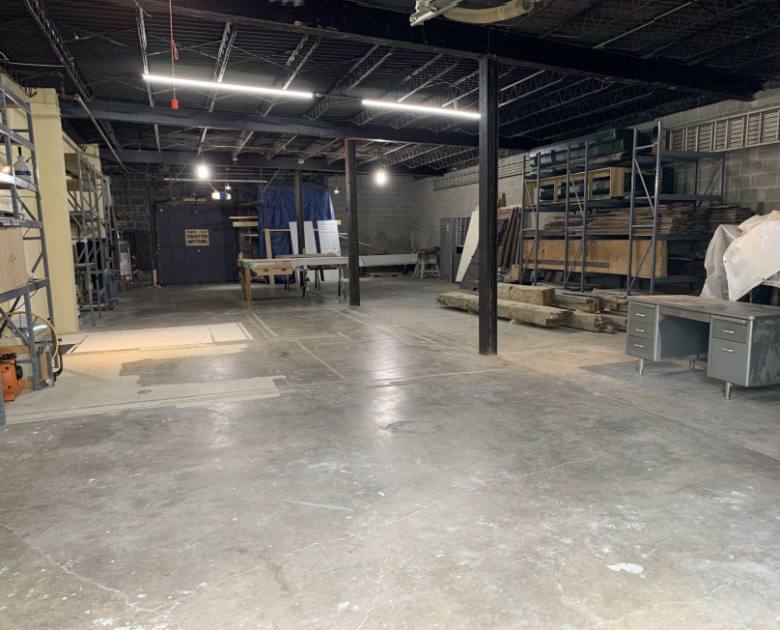
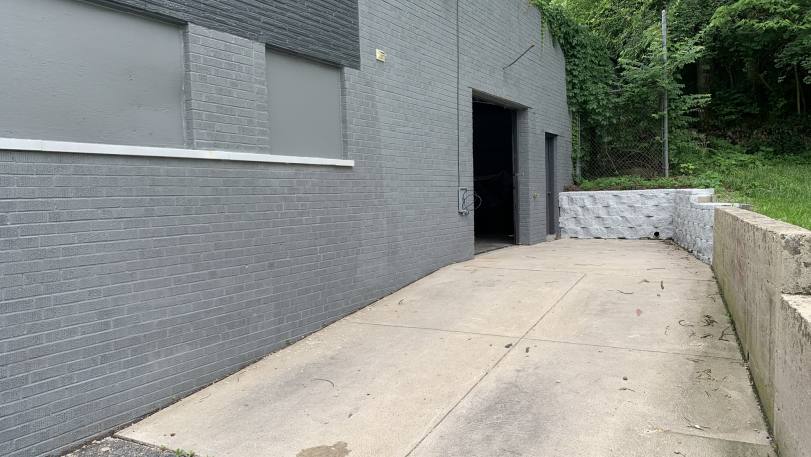
- • 1 Drive-In
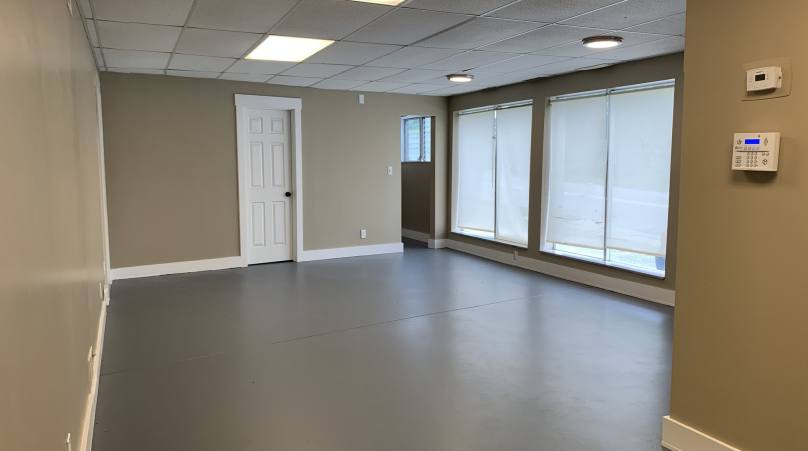
- • New LED Lights
- • On-Site Parking
- • Building and Monument Signage Available
Additional Photos


Listing Agents

Alex Boymel
O: 513-322-8323
M: 513-608-4932
aboymel@bergmancommercial.com
O: 513-322-8323
M: 513-608-4932
aboymel@bergmancommercial.com
While we strive to provide the most accurate information, all listing information, and demographic data, is provided by third-parties. As such, MyEListing will not be responsible for the accuracy of the information. It is strongly recommended that you verify all information with the listing agent, and any relevant agencies, prior to making any decisions.