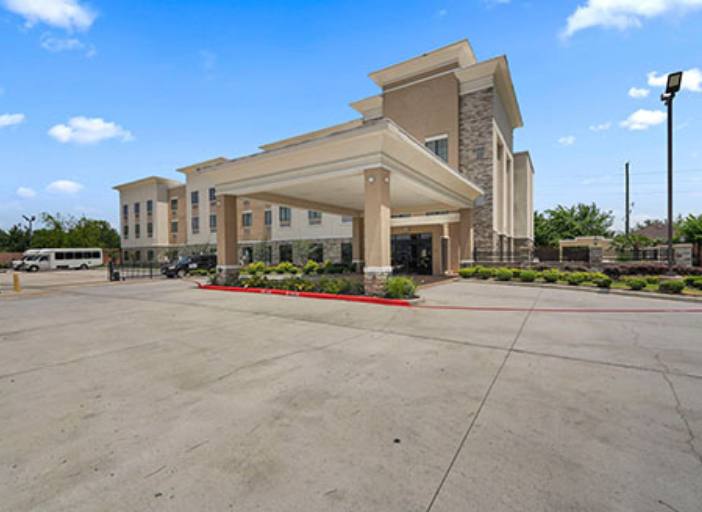
Specialty Real Estate
14380 North Freeway Houston, TX 77090
14380 North Freeway Houston, TX 77090
Details & Description
Property Highlights
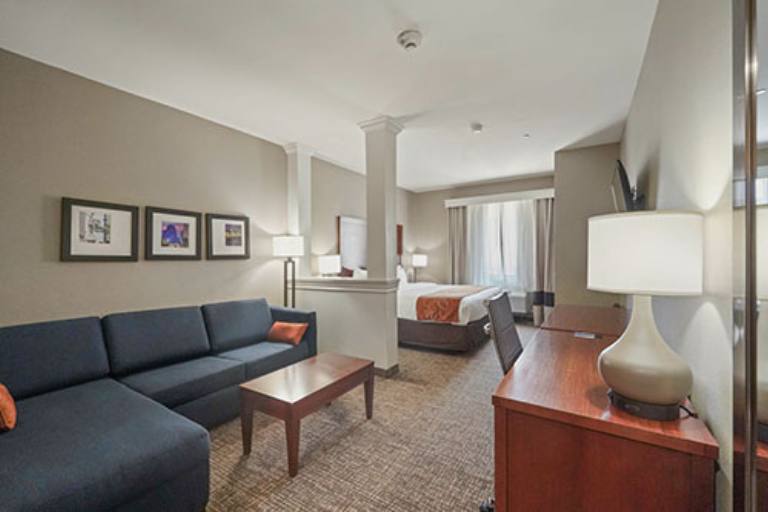
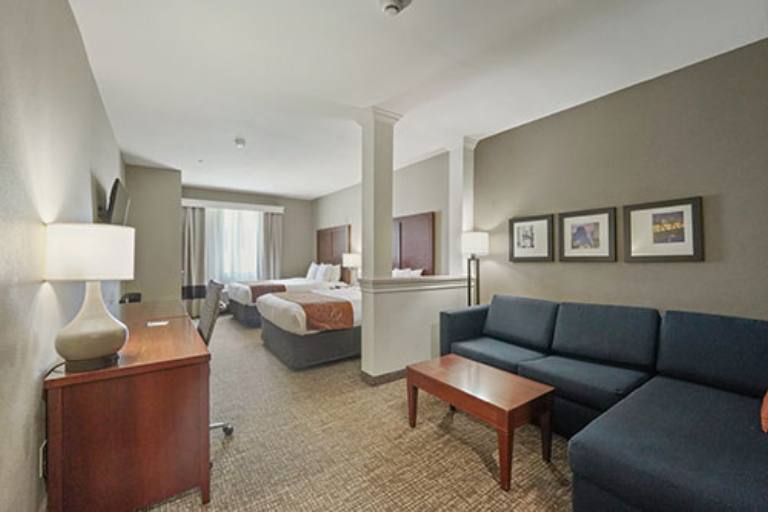
• Current room accommodations: (37) King Suites; (2) Accessibility King Suites; (26) Double Quee
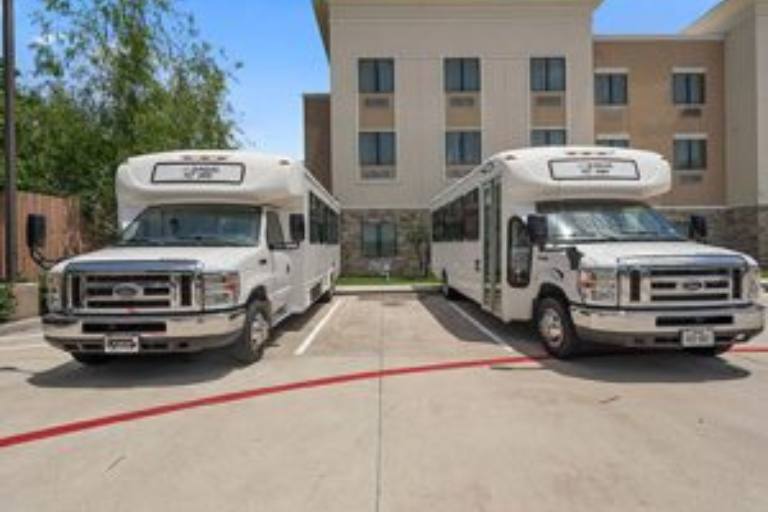
• Located 15 minutes from George Bush Airport and 45 minutes to Hobby Airport
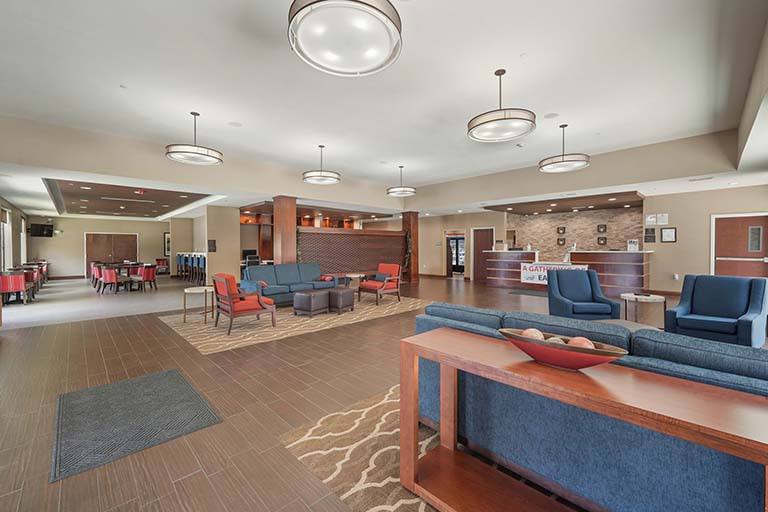
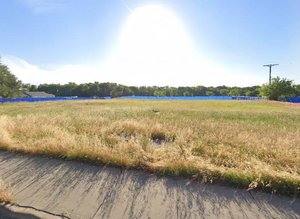
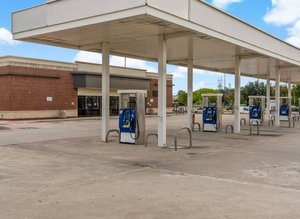
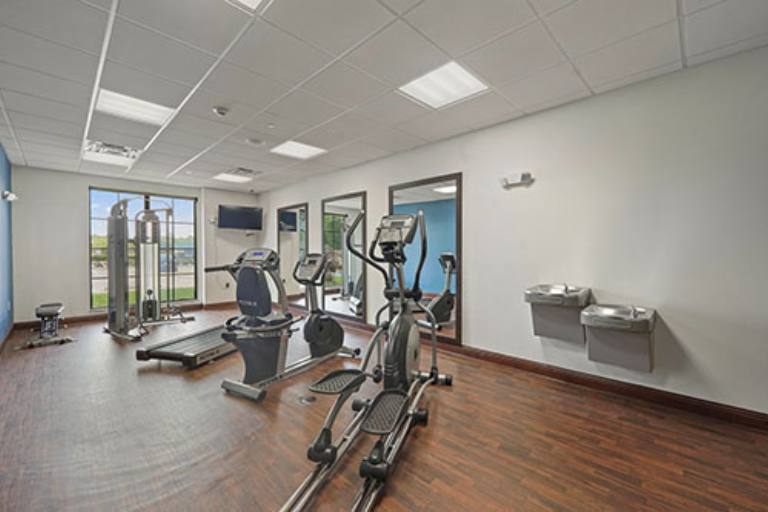
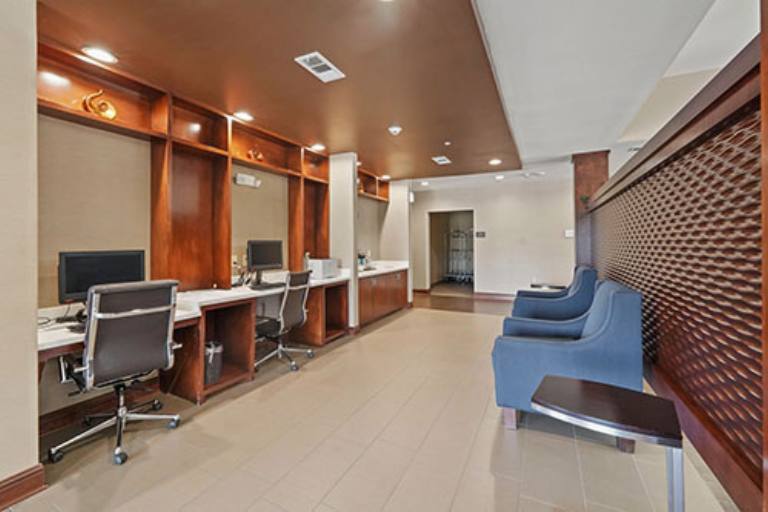
Additional Photos
Listing Agents

Angela Harwell
O: 214-433-6063
a.harwell@orioncrg.com
O: 214-433-6063
a.harwell@orioncrg.com
While we strive to provide the most accurate information, all listing information, and demographic data, is provided by third-parties. As such, MyEListing will not be responsible for the accuracy of the information. It is strongly recommended that you verify all information with the listing agent, and any relevant agencies, prior to making any decisions.