Retail Space
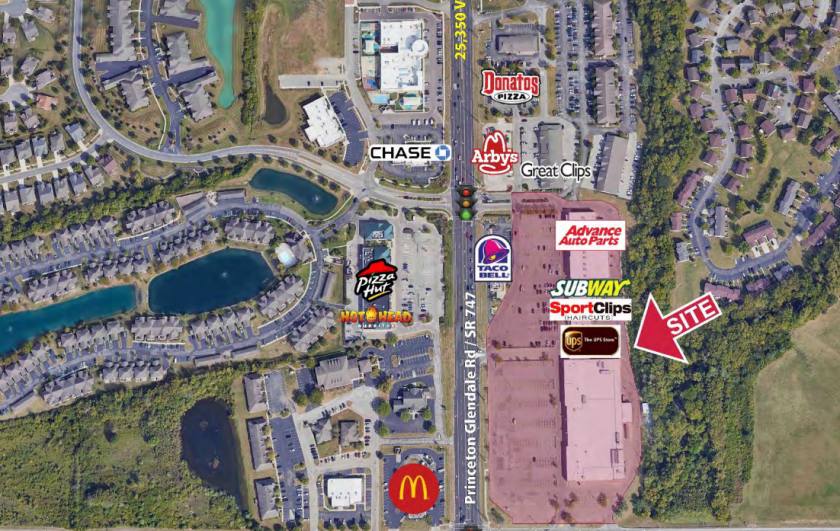
8136 Princeton Glendale Road Beckett Ridge, OH 45069
8136 Princeton Glendale Road Beckett Ridge, OH 45069

Details & Description
Property Highlights
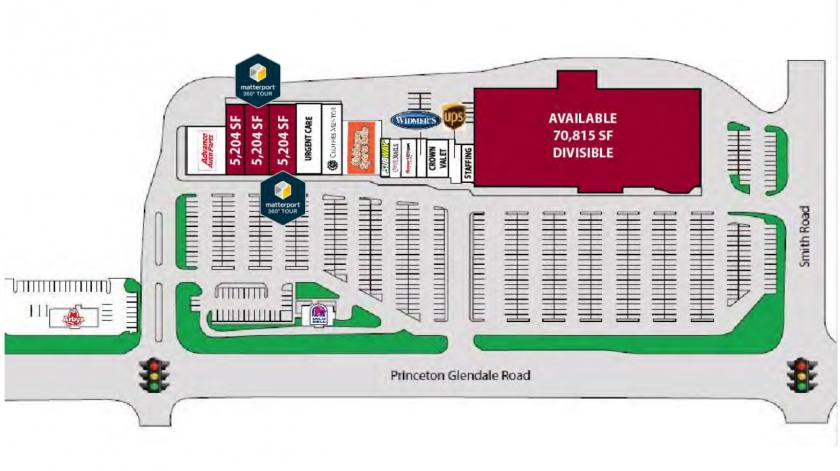
- • 5,204 SF - 10,480 SF
- • Direct traffic light access
- • Pylon signage
Listing Agents

TC Bartoszek
O: 513-588-1840
M: 513-535-0563
tcbartoszek@lee-associates.com
O: 513-588-1840
M: 513-535-0563
tcbartoszek@lee-associates.com

Molly Hoffman
O: 513-588-1843
mhoffman@lee-associates.com
O: 513-588-1843
mhoffman@lee-associates.com
While we strive to provide the most accurate information, all listing information, and demographic data, is provided by third-parties. As such, MyEListing will not be responsible for the accuracy of the information. It is strongly recommended that you verify all information with the listing agent, and any relevant agencies, prior to making any decisions.