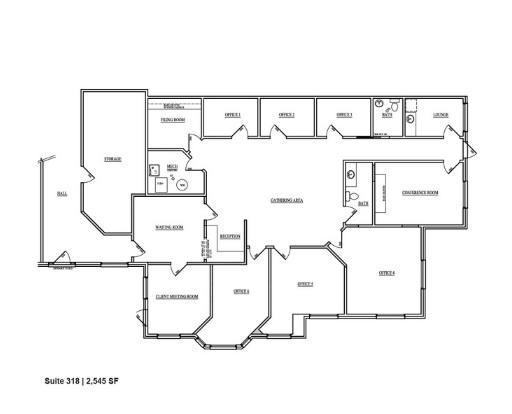
Office Space
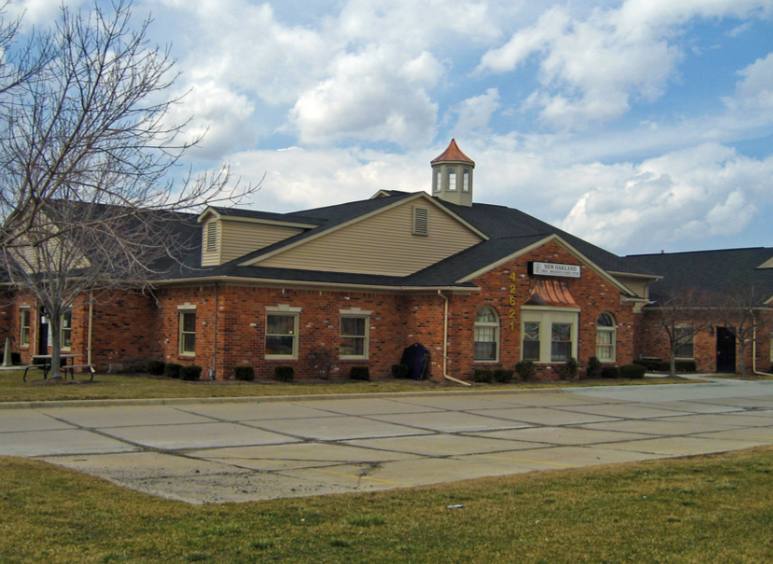
42621 - 42633 Garfield Rd Clinton Township, MI 48038
42621 - 42633 Garfield Rd Clinton Township, MI 48038
Details & Description
Property Highlights
- • Year Built 1988
- • Immediate Occupancy!
- • Aggressive Lease Rates
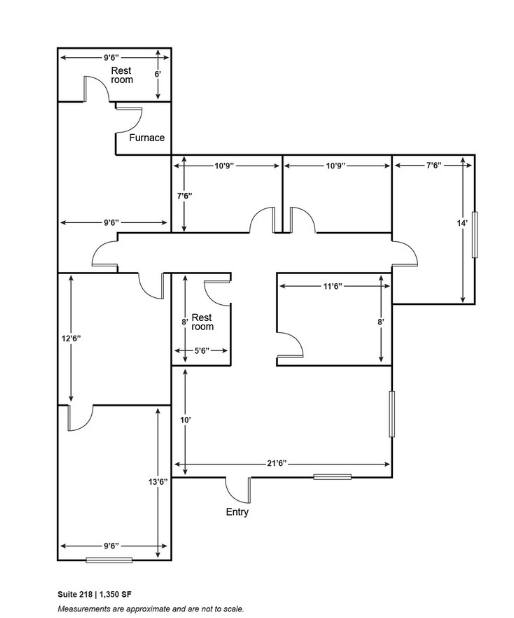
- • Main Road Signage and Direct Suite Access
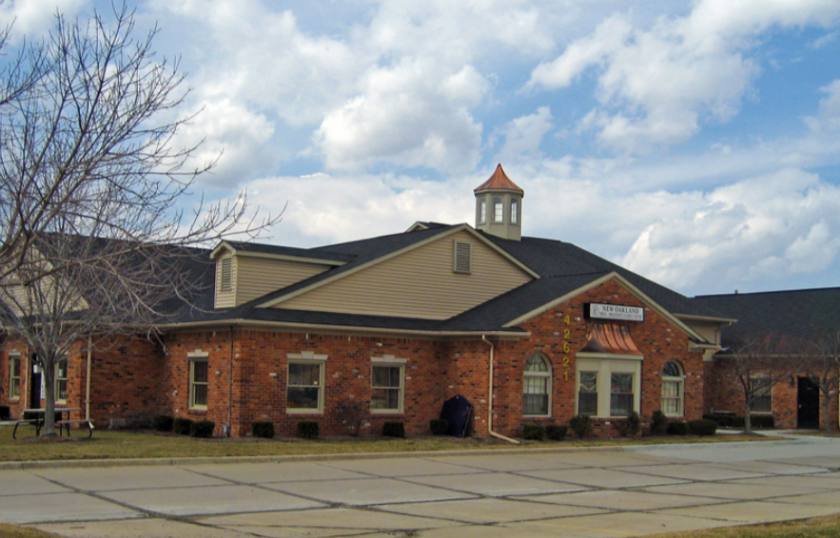
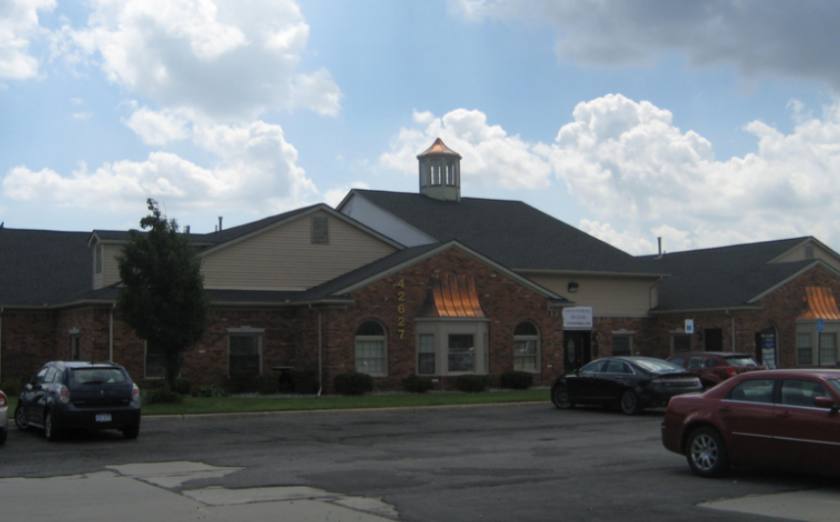
Additional Photos
Listing Agents

Phillip Myers
O: 248-281-9904
M: 586-242-4047
phil@pacommercial.com
O: 248-281-9904
M: 586-242-4047
phil@pacommercial.com
While we strive to provide the most accurate information, all listing information, and demographic data, is provided by third-parties. As such, MyEListing will not be responsible for the accuracy of the information. It is strongly recommended that you verify all information with the listing agent, and any relevant agencies, prior to making any decisions.


