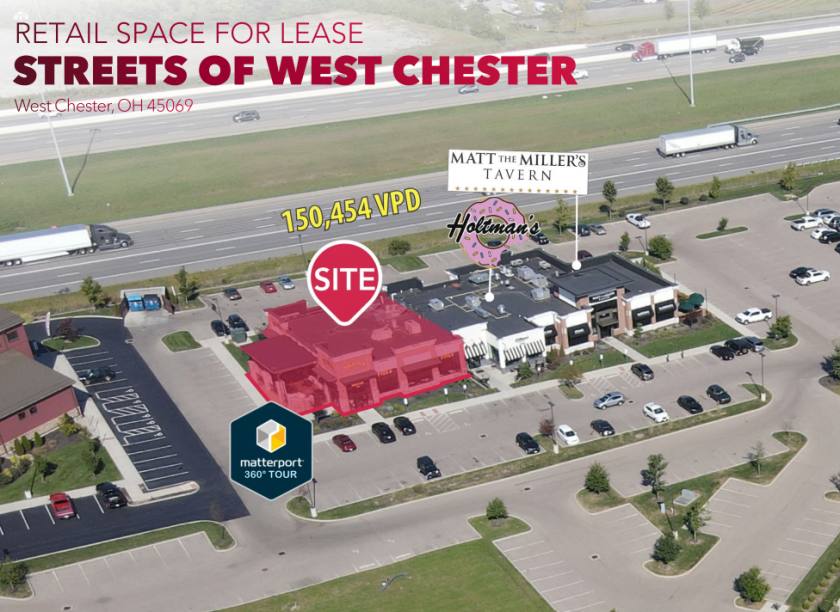
Retail Space
Streets of West Chester Hamilton, OH 45015
Streets of West Chester Hamilton, OH 45015
Details & Description
Property Highlights
- • Located in fast growing West Chester market
- • Endcap spot with spacious patio
- • ALL FF&E and Liquor License available
- • Highway Frontage
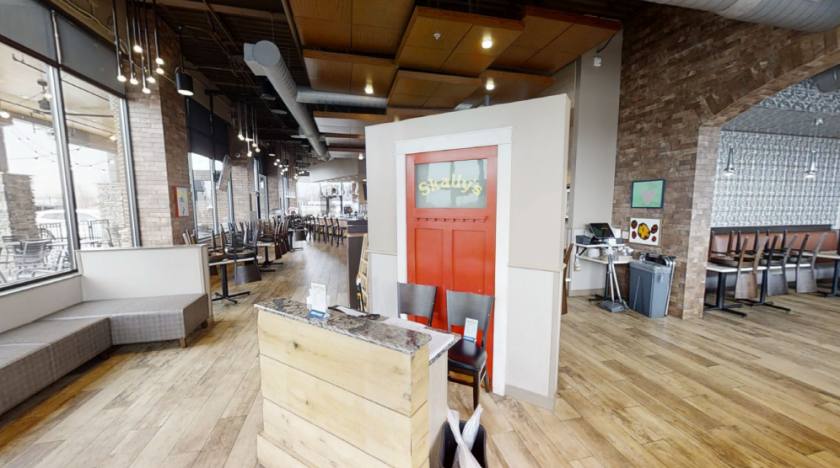
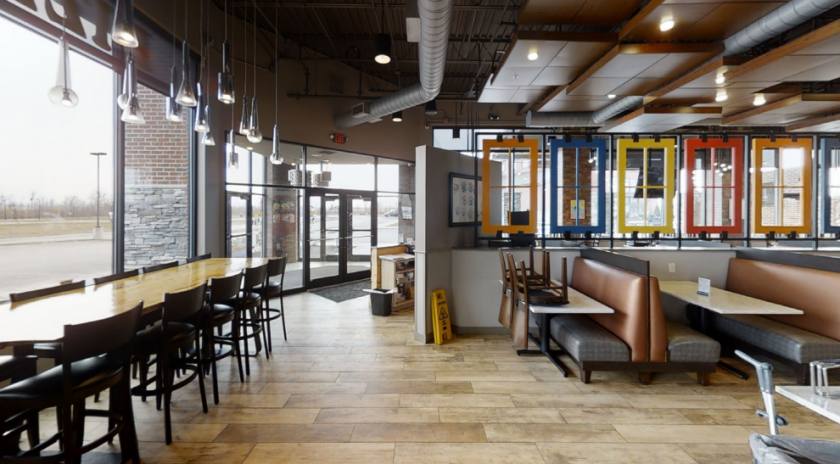
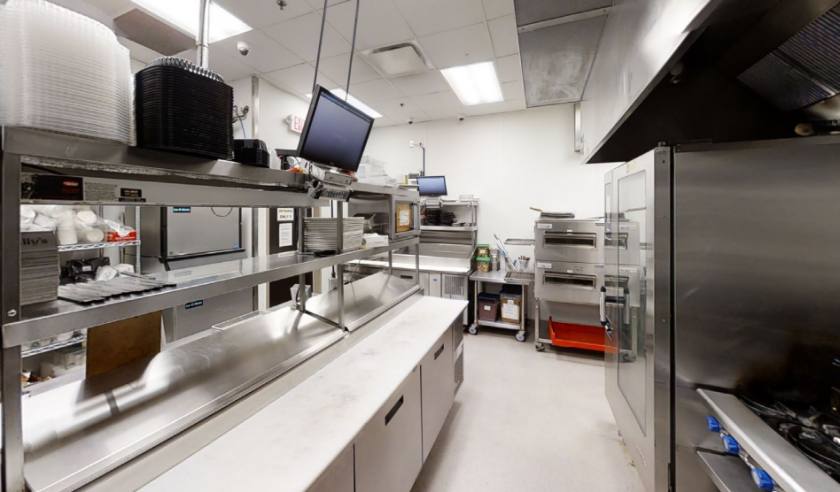
Additional Photos

Listing Agents

TC Bartoszek
O: 513-588-1840
M: 513-535-0563
tcbartoszek@lee-associates.com
O: 513-588-1840
M: 513-535-0563
tcbartoszek@lee-associates.com

Molly Hoffman
O: 513-588-1843
mhoffman@lee-associates.com
O: 513-588-1843
mhoffman@lee-associates.com
While we strive to provide the most accurate information, all listing information, and demographic data, is provided by third-parties. As such, MyEListing will not be responsible for the accuracy of the information. It is strongly recommended that you verify all information with the listing agent, and any relevant agencies, prior to making any decisions.


