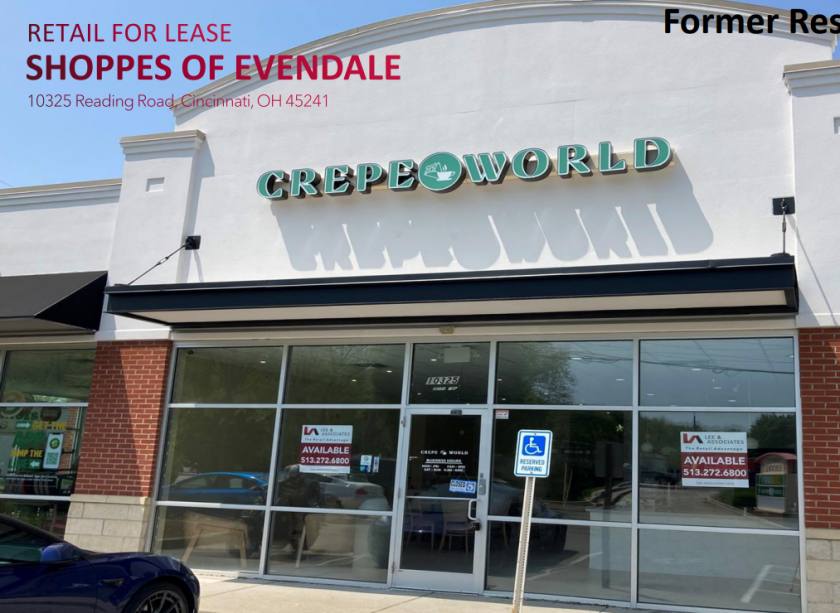
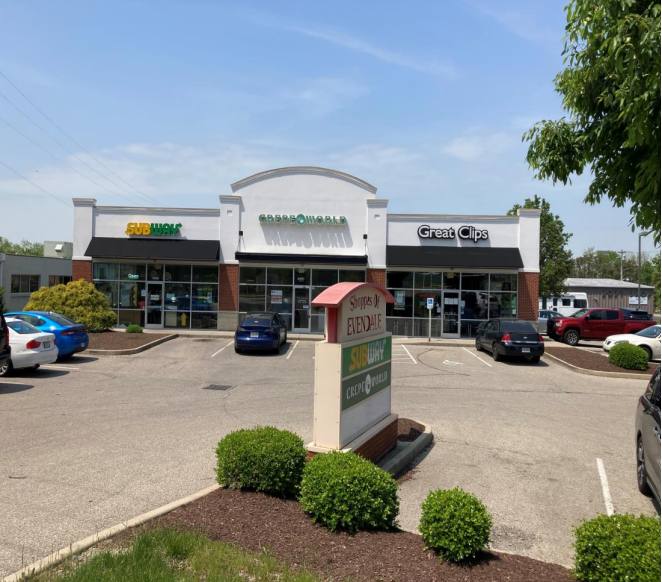
Retail Space
10325 Reading Road Cincinnati, OH 45241
10325 Reading Road Cincinnati, OH 45241
Details & Description
Property Highlights
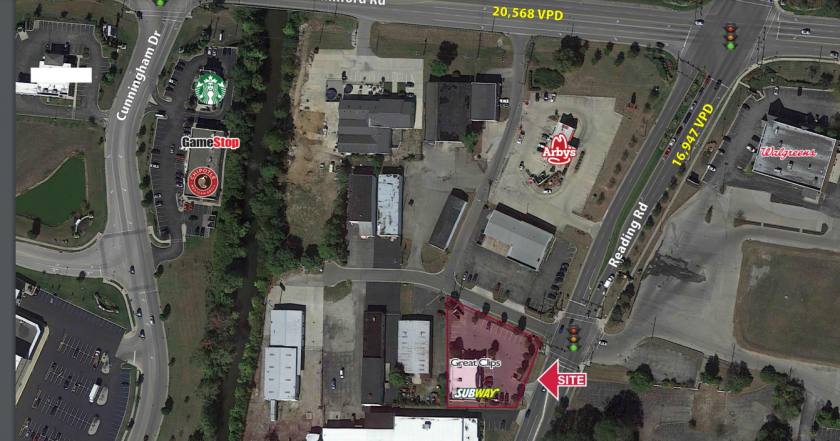
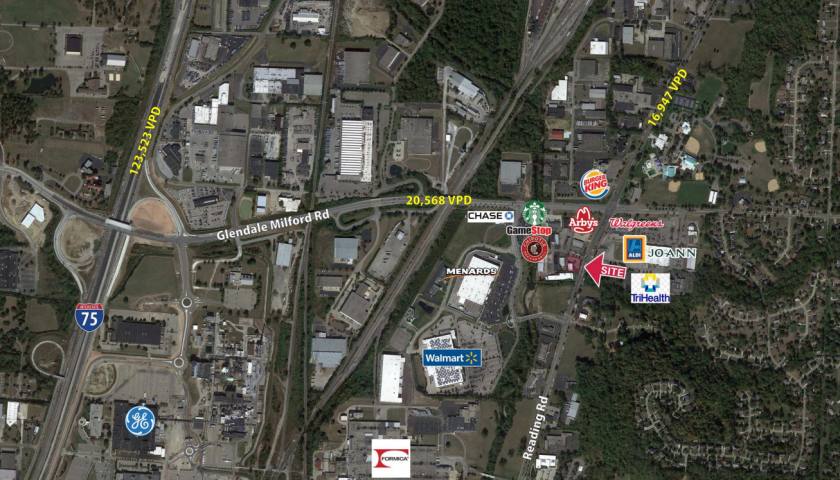
• TRAFFIC COUNTS : Glendale-Milford Road – 20,568 VPD; Reading Road – 16,947 VPD
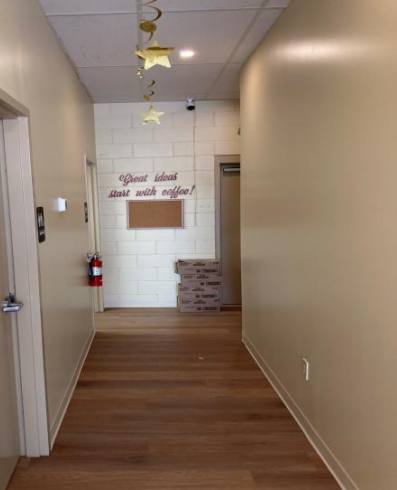
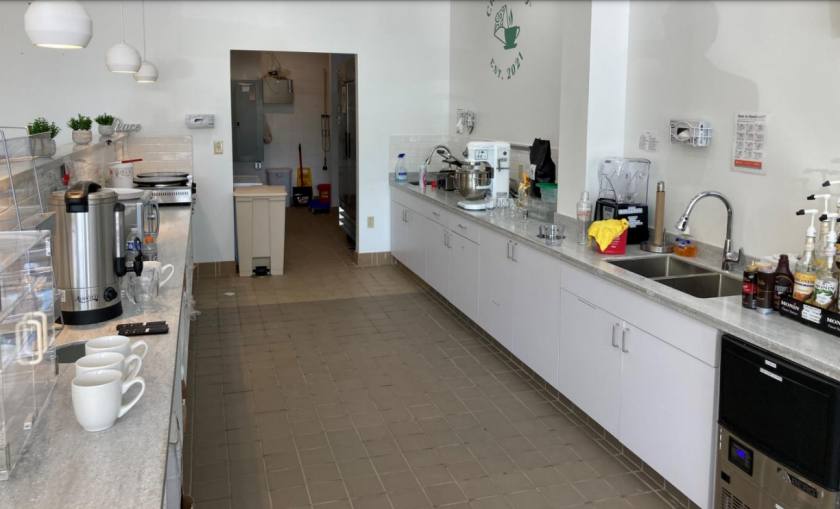
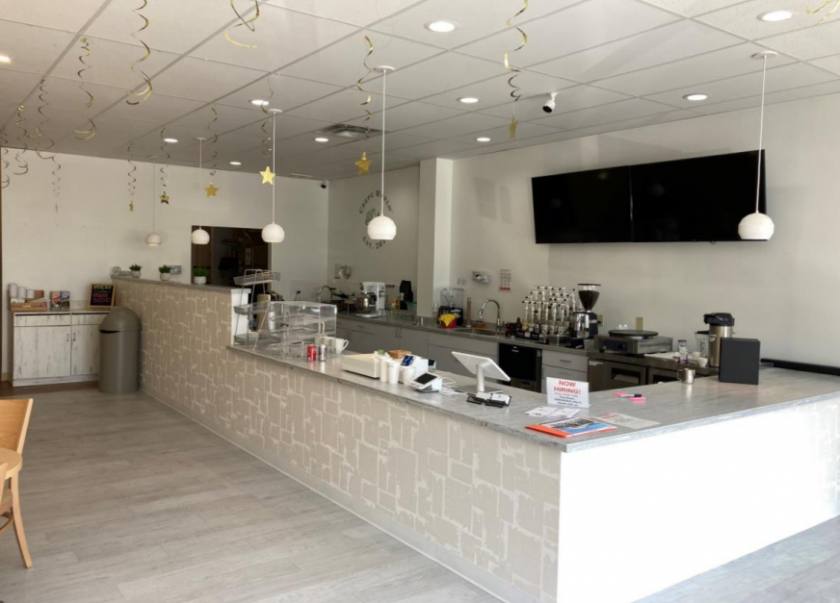
• Former Coffee/ Crepe Shop, excellent condition, 2 washrooms, prep kitchen, front counters
Additional Photos
Listing Agents

John Thompson
O: 513-588-1842
M: 513-703-2500
jthompson@lee-associates.com
O: 513-588-1842
M: 513-703-2500
jthompson@lee-associates.com
While we strive to provide the most accurate information, all listing information, and demographic data, is provided by third-parties. As such, MyEListing will not be responsible for the accuracy of the information. It is strongly recommended that you verify all information with the listing agent, and any relevant agencies, prior to making any decisions.